2021-11-10 18:55 |
XRP (XRP) is very close to both long- and short-term diagonal and horizontal resistance levels. Technical indicators and the price action support the possibility that the token will break out.
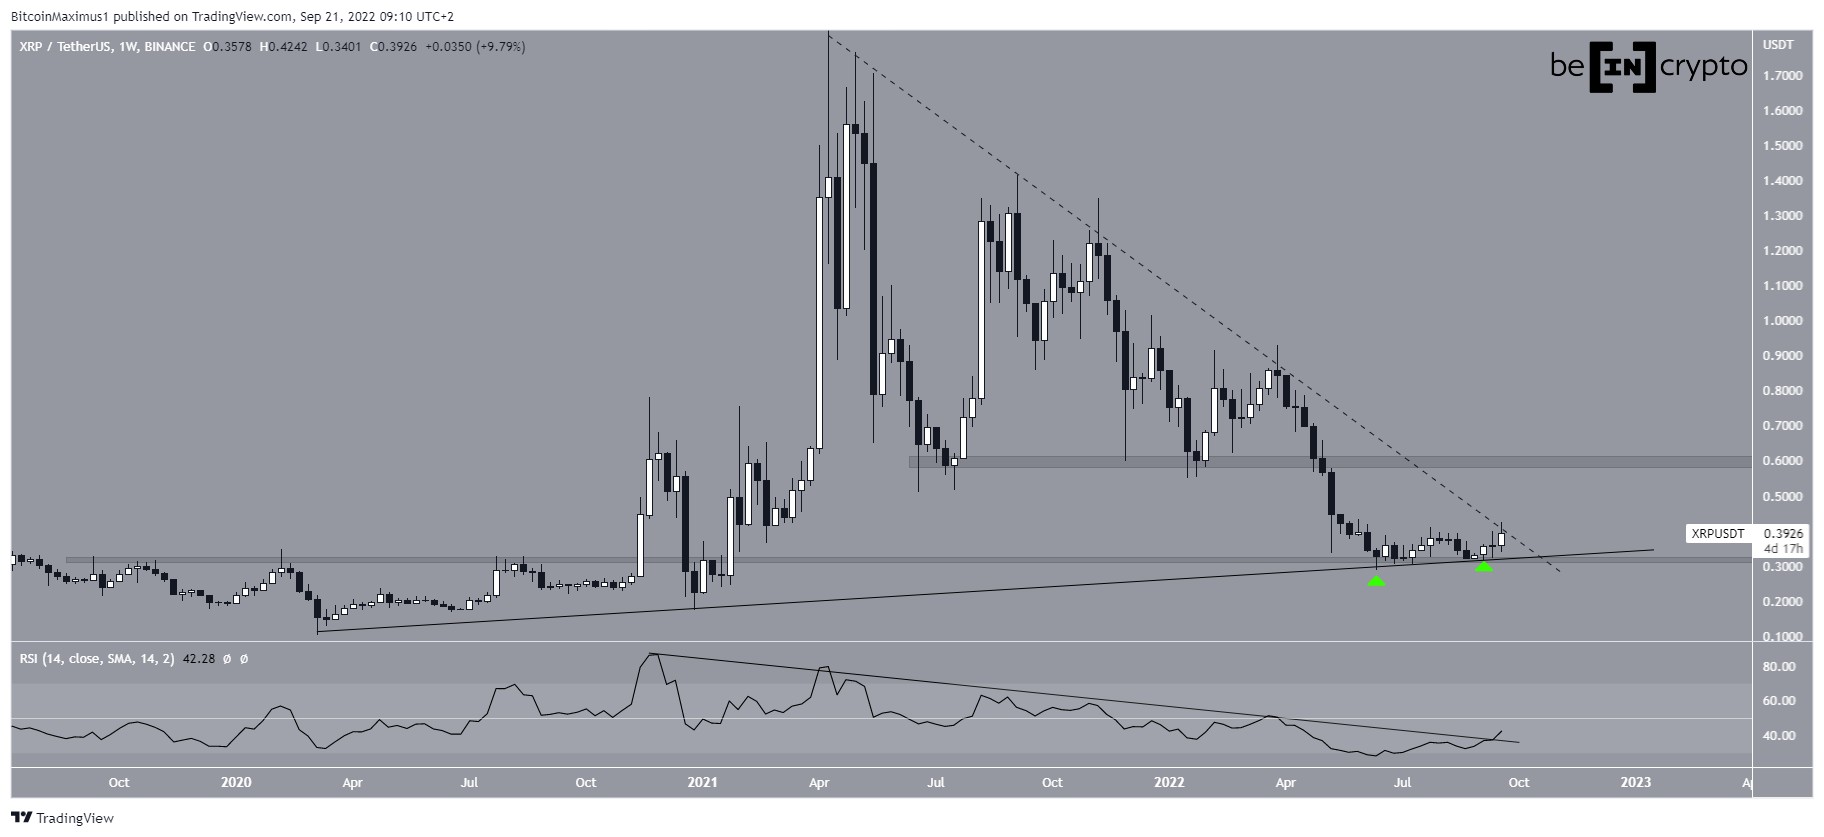
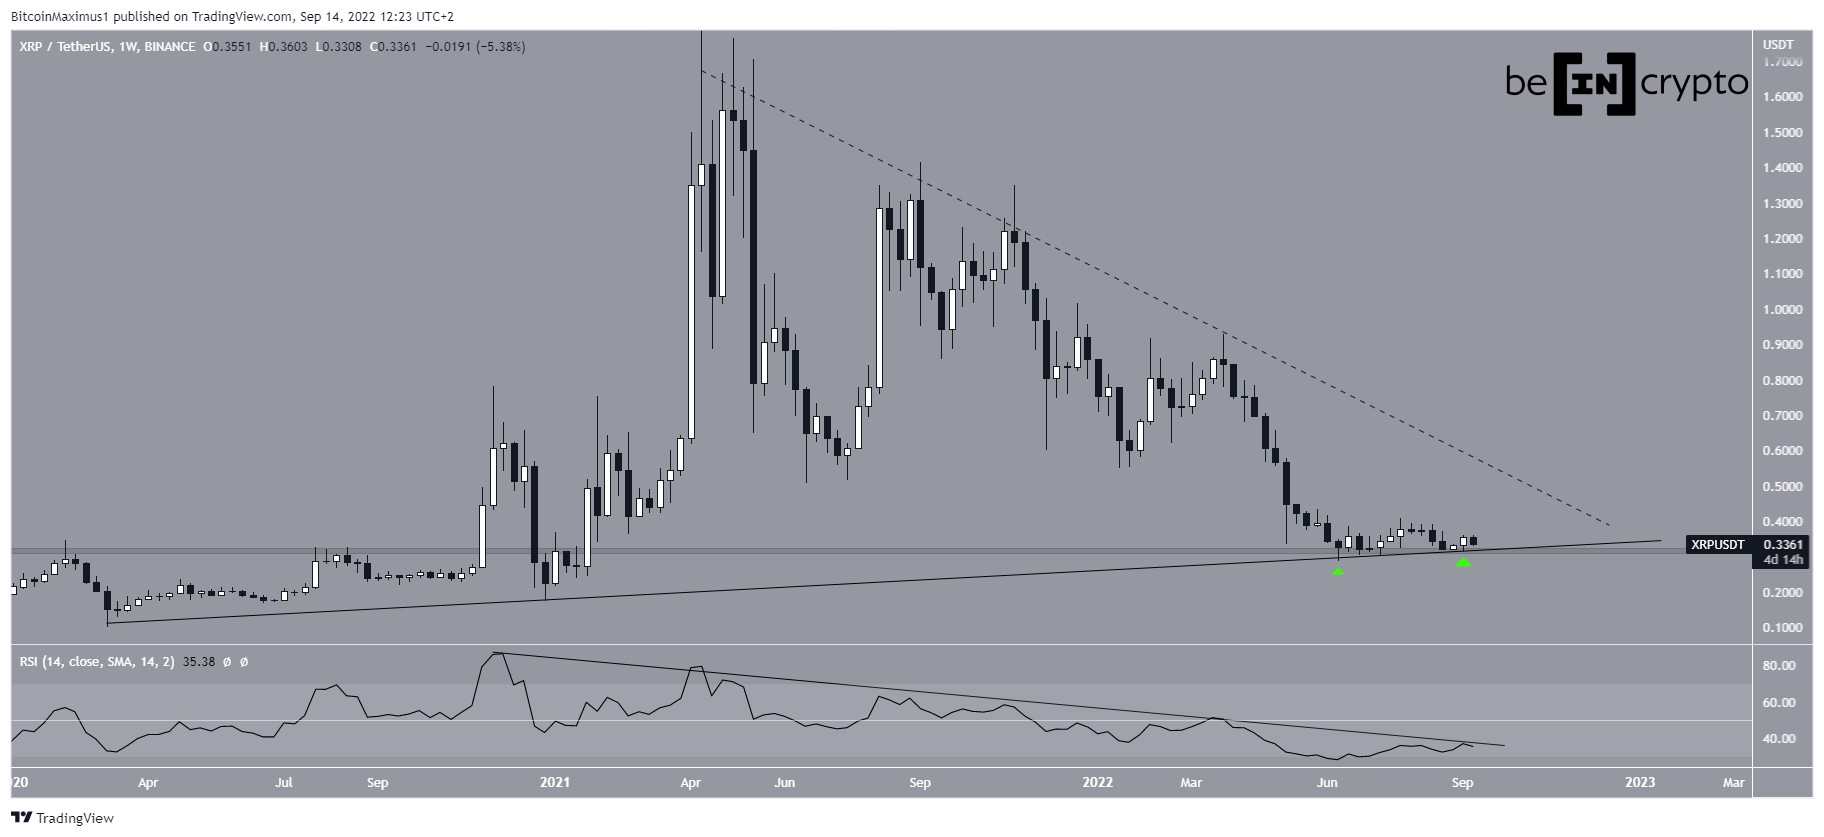
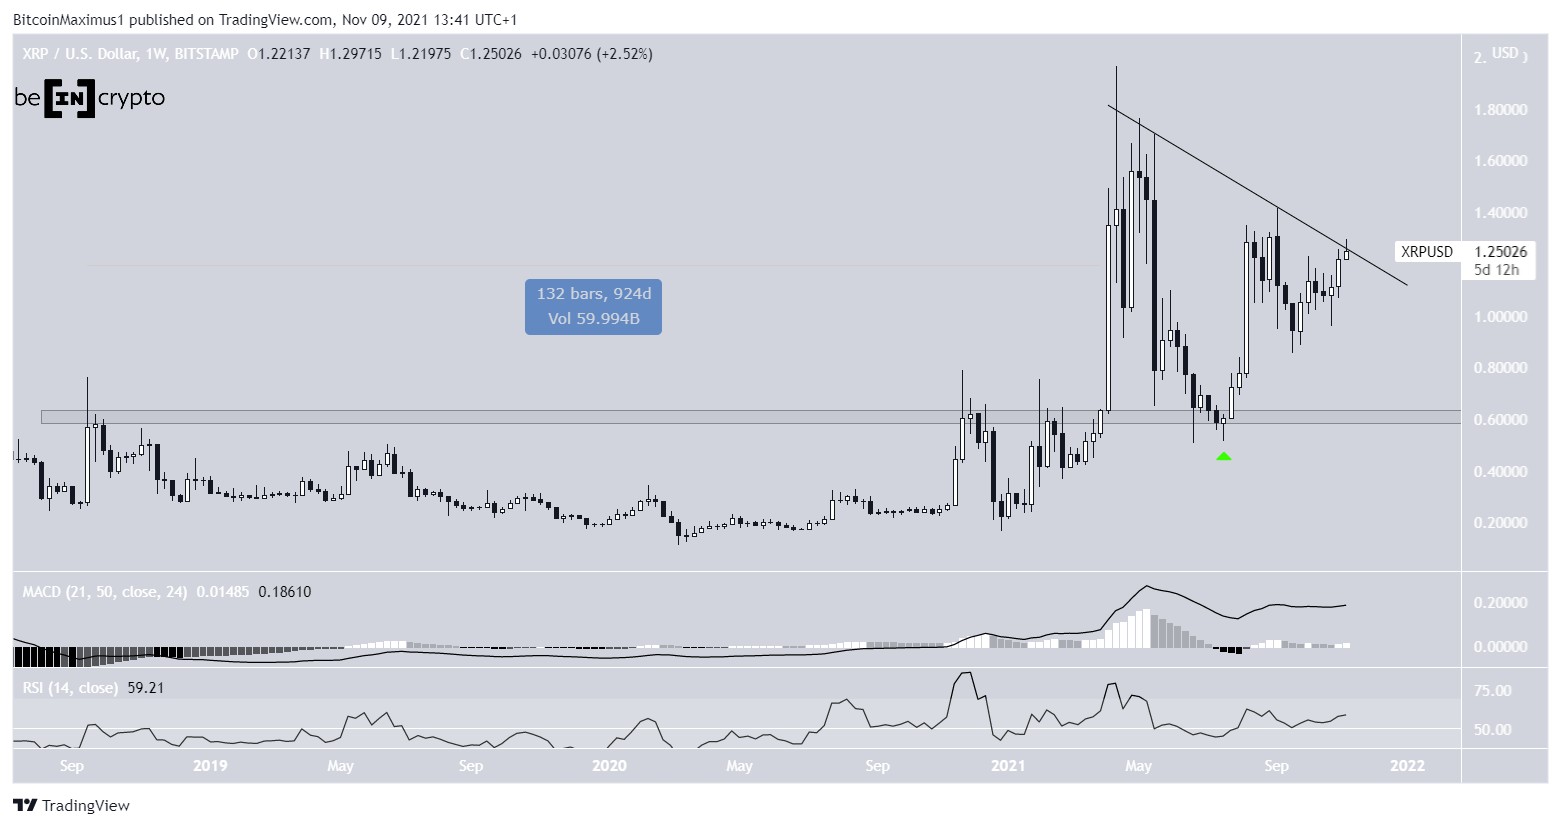
XRP has been increasing since the week of July 19-26, when it bounced at the $0.60 horizontal area. The bounce validated the area as support. This was a crucial development, since previously, the area had acted as resistance for 924 days.
The upward movement is supported by both the MACD and RSI.
The MACD, which is created by a short- and a long-term moving average (MA), is positive and moving upwards. This means hat the short-term MA is moving faster than the long-term one, and is a sign of bullish trend.
The RSI, which is a momentum indicator, is above 50. This means that momentum is bullish.
However, XRP is still following a descending resistance line, which has been in place since the April high of $1.96.
A breakout above it would confirm that the correction is complete.
Chart By TradingView When will XRP break out?The daily chart shows that XRP is attempting to break out from the $1.40 resistance area. This is the 0.618 Fib retracement resistance level when measuring the entire downward movement.
Breaking out above this level would likely take XRP all the way to its Sept highs. Furthermore, it would cause a breakout from the previously outlined descending resistance line.
Similarly to the weekly time-frame, the RSI and MACD are moving upwards in the daily time-frame, supporting the possibility that XRP will break out.
Chart By TradingView Wave countCryptocurrency trader @Altstreetbet outlined a XRP chart, stating that the token has begun a new upward movement and will soon move above $2.
Source: TwitterThe wave count does suggest that XRP is in wave three (orange) of a five wave upward movement.
The increase since July 20 (highlighted in green) is very likely to be a five wave upward movement. Therefore, it suggests that the direction of the trend is upwards, while the Sept drop (highlighted in black) was a corrective structure.
In this case, XRP has just begun wave three.
If the token moves above its April highs at $1.96, the next resistance would be at $2.86. This is the 1.61 external Fib retracement level when measuring the entire drop.
Chart By TradingViewFor BeInCrypto’s latest Bitcoin (BTC) analysis, click here.
What do you think about this subject? Write to us and tell us!
The post Bullish Momentum Sees XRP 10% Away From Breaking September Highs appeared first on BeInCrypto.
origin »Bitcoin price in Telegram @btc_price_every_hour
Ripple (XRP) на Currencies.ru
|
|