2019-5-13 16:44 |
Bitcoin has a bullish short-term outlook, with the BTC / USD pair now trading at its highest level since September 2018 The BTC / USD pair has found strong technical resistance from the $7,300 level A large inverted head and shoulders pattern has now formed on the daily time frame Bitcoin / USD Short-term price analysis
BTC has a bullish short-term trading outlook, with the BTC / USD pair moving to its highest trading level since September 2018.
The four-hour time frame is showing that the BTC / USD pair is attempting to move lower after finding strong resistance from the $7,300 level. The $6,330 and $5,600 levels currently offer the strongest forms of technical support if a deeper downside correction occurs.
Technical indicators on four-hour time frame appear overstretched and are attempting to turn lower.
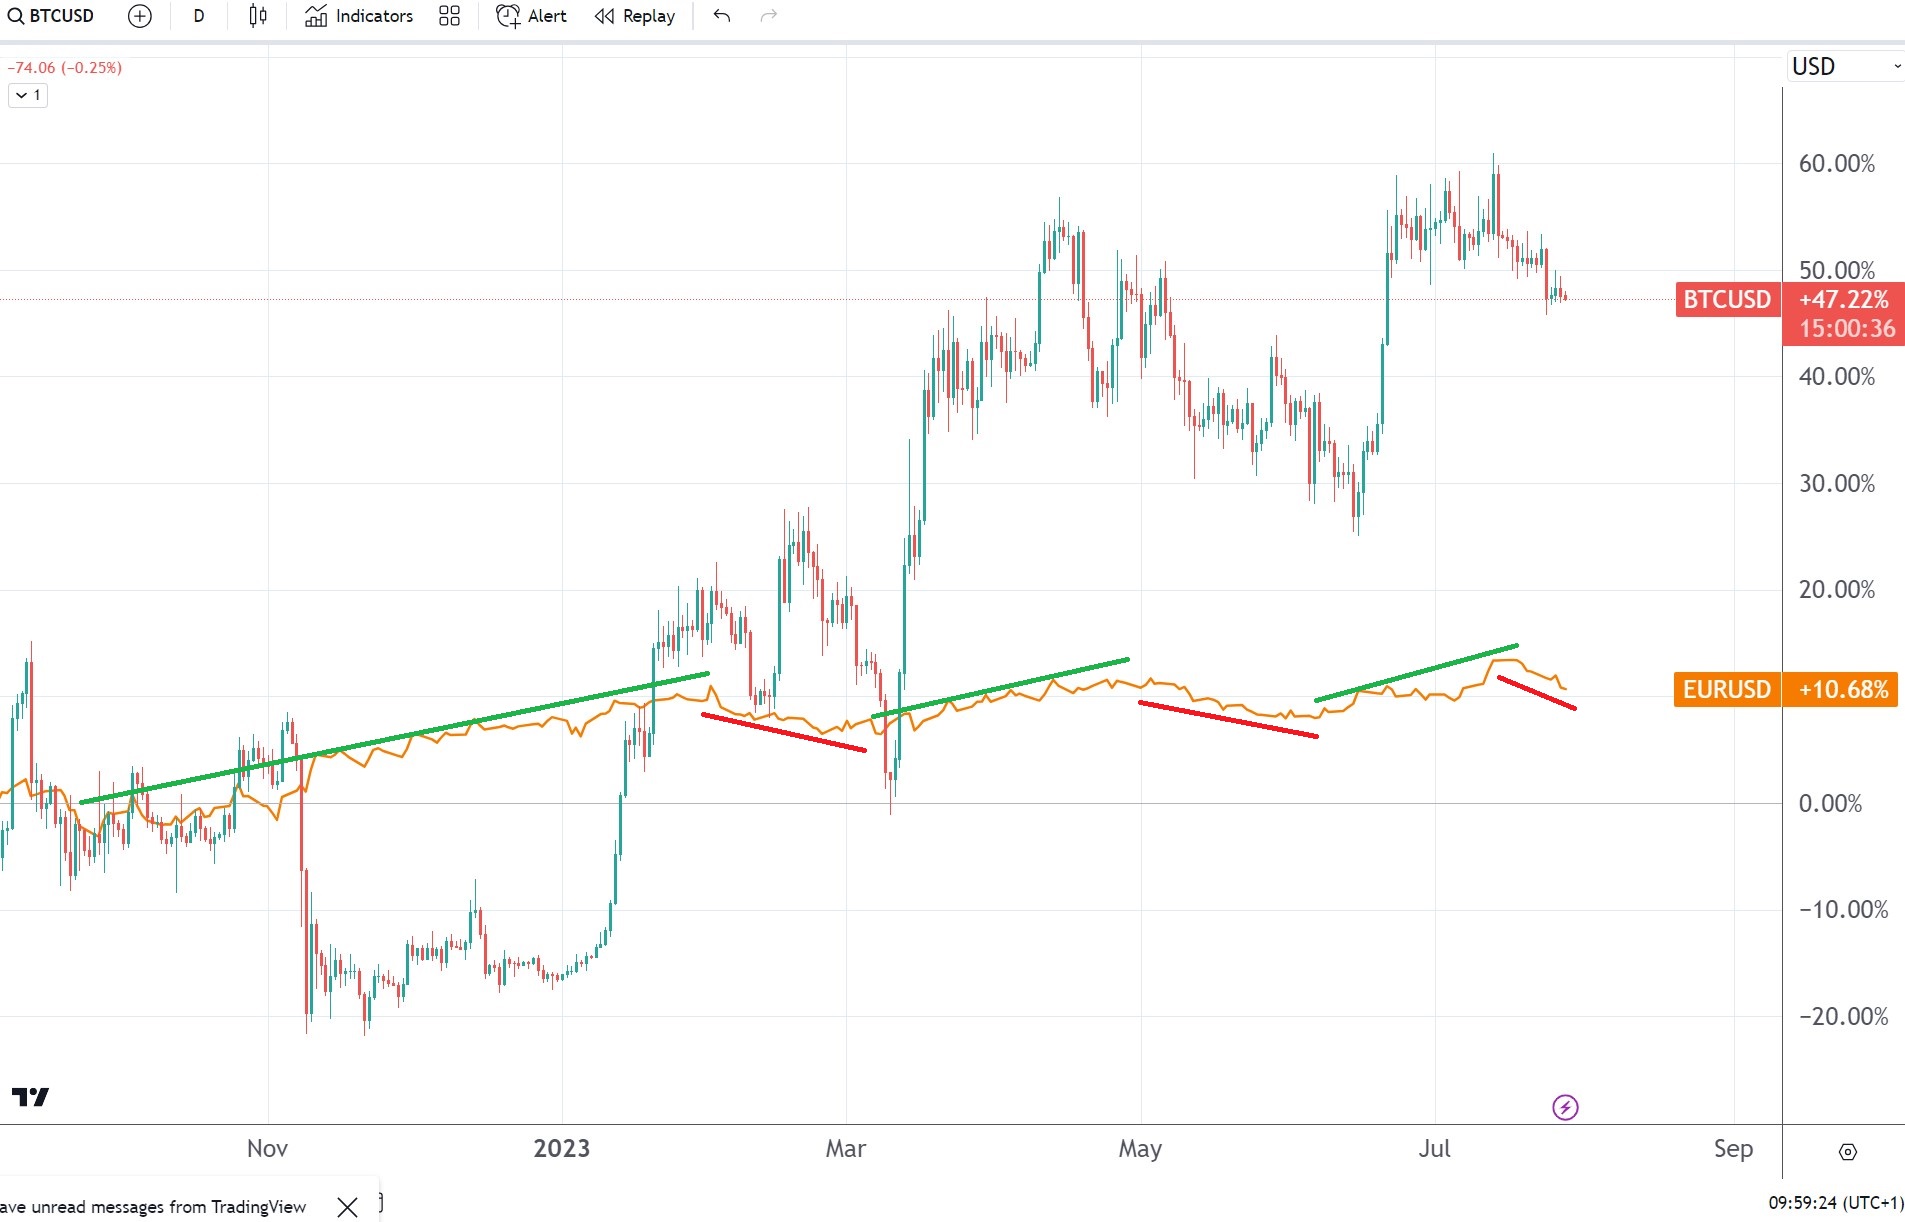
BTC / USD H4 Chart by TradingView
Pattern Watch
Sellers will need further technical confirmation that a short-term price high is now in place across the four-hour time frame.
Relative Strength Index
The Relative Strength Index on the four-hour time frame is correcting lower from extreme overbought conditions.
MACD Indicator
The MACD indicator on the four-hour time frame is attempting to turn lower and appears overstretched.
Bitcoin / USD Medium-term price analysisBTC has a strong bullish bias over the medium-term, with the BTC / USD pair advancing sharply higher after breaking above the $6,500 resistance level.
The daily time frame is now showing that a large inverted head and shoulders pattern has formed, with the BTC / USD pair turning lower from the neckline of the bullish pattern.
Technical indicators on the daily time frame are bullish, although they are extremely overbought.
BTC / USD Daily Chart by TradingView
Pattern Watch
Traders should note that the bullish inverted head and shoulders pattern on the daily time frame has an upside projection of over $4,000.
Relative Strength Index
The Relative Strength Index is bullish, although it is also extremely overbought.
MACD Indicator
The MACD indicator on the daily time frame remains bullish, although it is now extremely overbought.
Bitcoin / USD Medium-term price analysisBTC has a strong bullish bias over the medium-term, with the BTC / USD pair now trading at its highest level since November 19th, 2018.
The daily time frame is showing that the BTC / USD pair is now approaching major technical resistance from the $6,400 and the $6,900 levels.
Technical indicators on the daily time frame are bullish, although they are starting to approach overbought territory.
BTC / USD Daily Chart by TradingView
Pattern Watch
Traders should note that a potential inverted head and shoulders pattern is starting to take shape on the daily time frame.
Relative Strength Index
The Relative Strength Index is bullish and has now moved into overbought territory.
MACD Indicator
The MACD indicator on the daily time frame is bullish, although it is starting to appear overstretched.
ConclusionBTC has surged sharply higher after breaking through the $6,500 resistance level and eroding all its heavy losses from November 2018.
Overstretched technical indicators on both time frames suggest that the BTC / USD pair could soon start to correct lower, although the formation of the inverted head and shoulders pattern on the daily time frame suggests that the cryptocurrency is likely to trade much higher over the medium-term.
In the unlikely case you need an intro to Bitcoin, check out our coin guide.
Bitcoin ChartChart byCryptoCompare baseUrl = "https://widgets.cryptocompare.com/"; var scripts = document.getElementsByTagName("script"); var embedder = scripts[ scripts.length - 1 ]; var cccTheme = { "General":{"borderWidth":"0px","borderColor":"#FFF","showExport":true}, "Tabs":{"borderColor":"#FFF","activeBorderColor":"rgba(28,113,255,0.85)"}, "Chart":{"fillColor":"#222","borderColor":"rgba(28,113,255,0.85)"}, "Conversion":{"lineHeight":"10px"}}; (function (){ var appName = encodeURIComponent(window.location.hostname); if(appName==""){appName="local";} var s = document.createElement("script"); s.type = "text/javascript"; s.async = true; var theUrl = baseUrl+'serve/v3/coin/chart?fsym=BTC&tsyms=USD,EUR,CNY,GBP'; s.src = theUrl + ( theUrl.indexOf("?") >= 0 ? "&" : "?") + "app=" + appName; embedder.parentNode.appendChild(s); })(); #ccpw-ticker-24557 .ccc-chart-header { background: #1c71ff} #ccpw-ticker-24557 #ccc-chart-block .exportBtnTop, #ccpw-ticker-24557 a.tabperiods.tabperiods_active, #ccpw-ticker-24557 .coin_details { color: #1c71ff; background: rgba(28,113,255,0.15); } #ccpw-ticker-24557 .coin_details { border: 1px solid rgba(28,113,255,0.16); } .ccpw-container_chart #ccpw-ticker-24557 .coin-container:after, .ccpw-container_four #ccpw-ticker-24557 .coin-container:after {border-color:#ccc !Important;}
The post BTC / USD Price Analysis: Bitcoin On The Run appeared first on Crypto Briefing.
origin »Bitcoin price in Telegram @btc_price_every_hour
CK USD (CKUSD) на Currencies.ru
|
|