2021-4-27 01:37 |
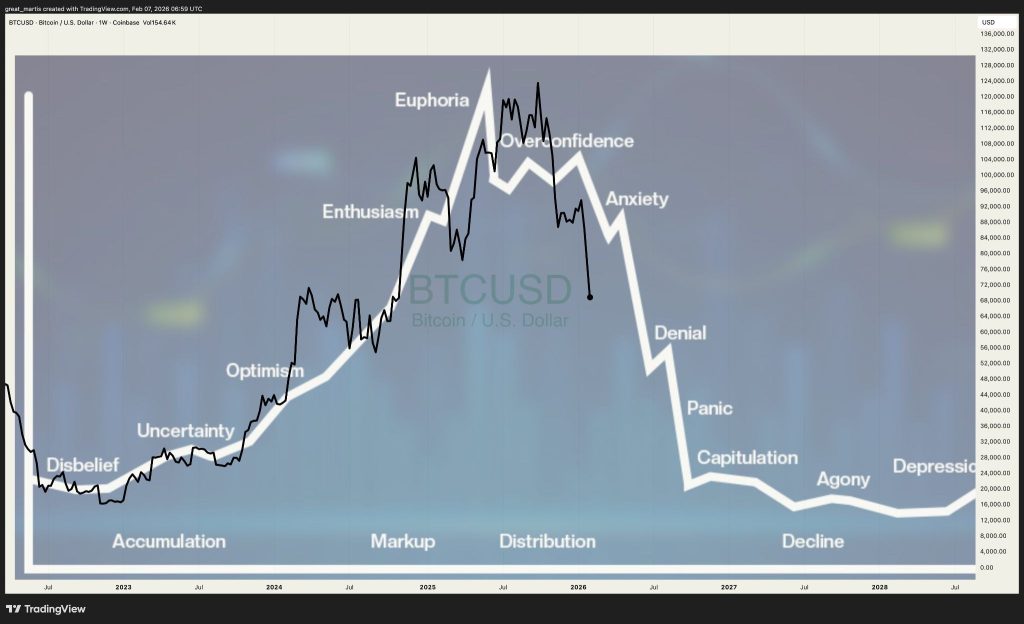
With an appreciation for bitcoin's market cycles, we can identify patterns to better gauge the progress of bull and bear markets alike.
Bitcoin’s On-Chain Market CyclesThis article is a collaboration by Glassnode and Bitcoin Magazine to introduce Bitcoiners to the world of on-chain analysis. Our aim is to simplify, demystify and improve access to on-chain data, helping you take the first steps into using these powerful new tools.
Bitcoin is a free market for exponential, digital monetary technology. It has attracted interest from all manner of investors ranging from the individual right through to global institutions. Number go up technology has driven both speculation and investor conviction, as the thesis of digital sound money is tested, challenged, and ultimately proven through price performance and adoption.
Within that context, bitcoin has proven to be a cyclical asset, with extreme price run-ups and lengthy and significant draw-downs. At all stages in these cycles, there are pools of people buying, selling, holding, transacting and mining within the Bitcoin network. To fully understand the psychology and characteristics of these market cycles, there are few data sets more suitable to study than the Bitcoin ledger itself.
In this article, we will explore some select on-chain metrics that provide insight into the sentiment and macro-spending patterns of hodlers, speculators and miners. The objective is to equip readers with the tools needed to appreciate the progress and data patterns as they relate to the current bull market.
On-Chain CharacterIn bear markets, interest in Bitcoin the protocol typically wanes, and by the end of it, only Bitcoiners, smart money and miners remain standing. These are the buyers of last resort, and they all have one goal: to accumulate as much bitcoin as possible before everyone else works it out.
For on-chain data, the patterns and fractals we observe during bear markets are largely driven by these low time preference accumulators. The chart below shows supply accumulation by long-term holders and how it consistently peaks during the darkest times.
Bull markets on the other hand, are a very different beast. The dynamics between on-chain supply and demand are in constant flux as new speculators and old hodlers compete for blockspace, profitability and test their resolve to hodl through epic price rises. Old hands typically begin to distribute in bulls, transferring their expensive coins into the hands of new speculators (who return the favor in bears, selling cheap coins at a loss to hodlers).
Bitcoin Realized Cap HODL WavesAs investors enter and exit this market, they leave behind on-chain footprints that capture the aggregate hodling conviction and spending patterns. Through study of Bitcoin cycles, we can establish sets of assumptions and fractals to describe the balance between supply and demand. With an appreciation for market cycles, and how different parties typically behave, we can use these patterns to better gauge the progress of bull and bear markets alike.
Bitcoiners and the Smart MoneyBitcoiners and the smart money tend to have a similar modus operandi. Their incentive is to accumulate sats as cheaply as possible and realize profits late in the bull cycle (if at all). As such, their total holdings grow during bear markets as sats are stacked and withdrawn to cold storage.
We can observe this in the HODL waves metric as older age bands (cool colors) increase in thickness, suggesting coins are maturing and are held by strong hands. The thicker these cool bands become, the more supply is owned by long-term holders.
Conversely, as old coins are spent, they are reclassified as young coins (warm colors) with a corresponding increase to young HODL wave thickness. Typically, smart money coins are spent only late in the bull market and when young age bands begin to swell in size, it may indicate a change in macro sentiment is underway. Note, coins older than five to six months are usually considered HODLed coins.
Bitcoin: HODL WavesThe Spent Output Age Bands provide a view on the age distribution for all coins spent that day. The chart below has been filtered to show only coins older than one year, indicative of hodlers. We can see that these old coins tend to be spent mostly during periods of high volatility, in particular:
In bull markets as old coins are distributed into market strengthIn bear markets during capitulation events and bear market ralliesNote also how, in the current bull market, old coin spending has slowed down lately. This suggests that fewer old coins are on the move and that conviction to hold remains strong.
Bitcoin: Spent Output Age BandsThe older a coin is, the more coin days it will have accumulated, and when it is spent, these coin days are “destroyed.”. Coin Days Destroyed (CDD) tracks the total sum of coin days destroyed each day. We can use this metric to observe macro-spending patterns and changes in behavior for long-term holders.
When Bitcoiners are accumulating, few old coins are spent, and CDD tends to be low. During late-stage bull markets, old coins are increasingly spent to realize profits, leading to a spike in CDD. Applying a long-term moving average (e.g., 90DMA) can help to smooth out noise and identify these macro shifts and even approximate market tops and bottoms.
Bitcoin: Supply-Adjusted CDDShort-Term SpeculatorsIt is well known that bitcoin volatility specializes in shaking out weak hands. The market often rewards long-term holders who exercise patience and punishes more inexperienced market participants and late bull cycle entrants. Long-term holders recognize this and tend to wait for peak market hype before realizing profits on expensive coins.
This creates a cyclical transfer of bitcoin wealth.
As hodlers distribute coins into new hands, the supply of young coins will swell in volume. The Realized Cap HODL waves are an ideal tool for tracking this wealth transfer via the expansion of young coin supply. We can see in the chart below, during the late stages of the 2013 and 2017 bull markets, the height of young coin bands (warm colors) spiked in three distinct instances. These peaks generally corresponded with the major rallies and corrections.
In the current bull market, we have seen the first major spike in young coin supply. What is interesting is the warmest colors (youngest coins) have not spiked as high this cycle. This likely reflects two phenomena:
Increased conviction of coin holders (including new institutional buyers) as the Bitcoin thesis is tested and proved on the macro stage.Greater access for speculation via off-chain derivatives leading to young coins having a smaller on-chain footprint.Bitcoin: Realized Cap HODL WavesWith this wealth transfer in mind, we can observe the proportion of old coin supply (1y–2y, blue) and compare it to the young coin supply (1w–1m, orange).
At the end of bear markets (green zones): 1y–2y coin supply is at a maximum and 1w–1m coin supply is at a minimum. This is the hodler accumulation we discussed earlier.At the end of bull markets (red zones): 1w–1m coin supply is relatively high (as more new speculators enter), while 1y–2y supply has declined significantly due to old coins selling into market strength.Bitcoin: Supply Last ActiveUsing this observation, we can construct the Realized HODL ratio metric (RHODL) which takes the ratio between the 1y–2y and 1w R.HODL waves, and creates a cyclical oscillator that closely tracks the macro market.
This metric describes the cyclical nature of wealth transfer events.
Bull market tops occur where old hands have transferred a large portion of their wealth to new hands, increasing liquid supply (max new holders, high RHODL).Bear market bottoms occur where old hands have accumulated a large portion of coins from new hands, decreasing liquid supply (max strong hands, low RHODL).Bitcoin: Realized HODL RatioMinersFinally, we take a look at proof-of-work miners. Miners are some of the biggest bulls in the space, having sunk large amounts of capital into ASIC hardware, logistical setups and power consumption. Their compulsory selling of coins necessitates distribution to cover costs, which are typically denominated in fiat currencies.
As such, observing miner incomes and hodled balances is often useful to establish a gauge for their sentiment and conviction. The chart below shows the balance of miner coins since 2016 and we can see three typical phases:
Distribution and declining balances in late bull markets as miners take profits into market strength.Reduced distribution in a bear market as miners cut costs, switch off ASICs or capitulate, leaving room for stronger miners to gain a larger share of the hash power.Accumulation with increasing balances in early bull markets as miners return to profitability, prices trend higher and broader market excitement around the halving kicks in. Bitcoin: Balance In Miner WalletsLastly, we can analyze the income side of the miner equation, seeking periods of profitability or income stress. Miners generally operate with long-time horizons. Given volatility in coin price, miners will assess income streams using long-term averages to make economic decisions.
The Puell Multiple is a metric that builds off this observation, taking the ratio between current miner income and its 365-day average. This creates an oscillator based on aggregate miner profitability.
High profitability occurs when current income is significantly above the yearly average (high Puell Multiple). In this instance, miners are accumulating coins much cheaper than market price and have an incentive to sell at higher profit margins, releasing additional supply into the market.Low profitability occurs when current income is significantly below the yearly average (low Puell Multiple). In this instance, miners are operating under relative income stress and must eventually switch off ASIC rigs. This generally leads to capitulation and the formation of bear market bottoms.Bitcoin: Puell Multiple SummaryThe supply and demand balance of the bitcoin market is an extremely dynamic system, despite being cyclical in nature. While the programmatic halving cycles may make it seem “obvious,” it remains difficult to pinpoint which stage of the bull market we are in. On-chain metrics provide tools and insights into macro changes in spending patterns and conviction of hodlers, speculators and miners.
When it comes to bull markets, there is an array of metrics and useful indicators, but a few patterns are important to pay attention to:
HODLers (old coins) distributing their wealthNew speculators (young coins) increasing their positionsMiners reaching peak profitabilityAll market cycles are unique, but the human response to profit, loss and incentives can be strangely predictable. The trick is knowing what to look for in the data, on-chain.
Disclaimer: This report does not provide any investment advice. All data is provided for information purposes only. No investment decision shall be based on the information provided here and you are solely responsible for your own investment decisions.
This is a guest post by Glassnode. Opinions expressed are entirely their own and do not necessarily reflect those of BTC Inc or Bitcoin Magazine.
origin »Bitcoin price in Telegram @btc_price_every_hour
Bitcoin (BTC) на Currencies.ru
|
|