2022-10-12 05:48 |
Bitcoin price is struggling below the $19,200 support against the US Dollar. BTC remains at a risk of more losses below the $18,500 support in the near term.
Bitcoin is showing bearish signs below the $19,200 and $19,500 levels. The price is trading below above $19,500 and the 100 hourly simple moving average. There is a key bearish trend line forming with resistance near $19,180 on the hourly chart of the BTC/USD pair (data feed from Kraken). The pair could continue to move down if it stays below the $19,500 level for a long time. Bitcoin Price Slides FurtherBitcoin price settled below the $20,000 support zone. BTC is following a slow and steady decline below the $19,500 pivot level and the 100 hourly simple moving average.
The price even traded below yesterday’s low and tested the $18,850 zone. A low is formed near $18,860 and the price is now consolidating losses. There was a minor recovery wave above the $19,000 resistance level. The price climbed above the 23.6% Fib retracement level of the recent decline from the $19,560 swing high to $18,860 low.
Bitcoin price is now trading below above $19,500 and the 100 hourly simple moving average. On the upside, an immediate resistance is near the $19,200 level.
There is also a key bearish trend line forming with resistance near $19,180 on the hourly chart of the BTC/USD pair. The trend line is near the 50% Fib retracement level of the recent decline from the $19,560 swing high to $18,860 low.
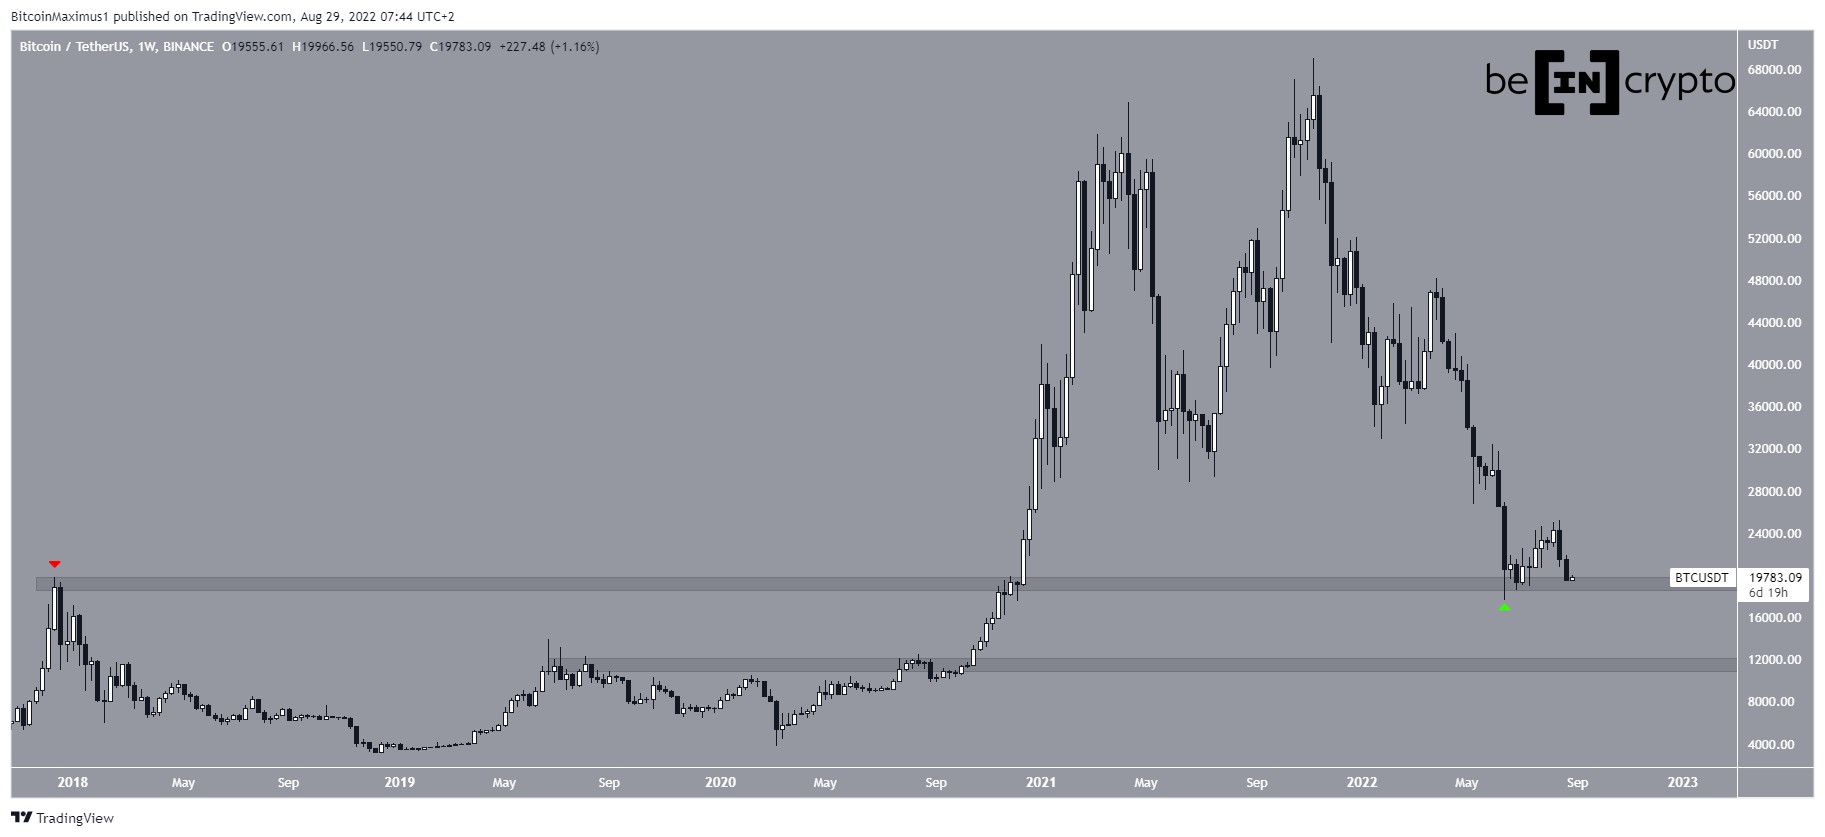
Source: BTCUSD on TradingView.com
A clear move above the trend line might send the price towards the 100 hourly simple moving average or the $19,500 resistance. Any more gains might send the price towards the $20,000 resistance zone.
More Losses in BTC?If bitcoin fails to recover above the $19,200 resistance zone, it could continue to move down. An immediate support on the downside is near the $18,850 zone.
The next major support is near the $18,550 zone. A downside break below the $18,550 support zone might trigger another sharp decline. In the stated case, there is a risk of a move towards the $17,800 support zone.
Technical indicators:
Hourly MACD – The MACD is now gaining pace in the bearish zone.
Hourly RSI (Relative Strength Index) – The RSI for BTC/USD is now near the 50 level.
Major Support Levels – $18,850, followed by $18,550.
Major Resistance Levels – $19,200, $19,500 and $20,000.
origin »Bitcoin price in Telegram @btc_price_every_hour
Bitcoin (BTC) на Currencies.ru
|
|