2023-8-14 07:30 |
Bitcoin price is moving lower from the $29,500 zone. BTC is showing bearish signs and might decline further below the $29,000 support zone.
Bitcoin is gaining bearish momentum below the $29,500 support. The price is trading below $29,500 and the 100 hourly Simple moving average. There is a connecting bearish trend line forming with resistance near $29,400 on the hourly chart of the BTC/USD pair (data feed from Kraken). The pair could continue to move down if it remains below $30,000 for a long time. Bitcoin Price Trims GainsBitcoin price failed to settle above the $30,000 resistance zone. BTC started yet another decline below the $29,650 and $29,500 levels to move into a bearish zone.
It tested the $29,100 support zone. A low is formed near $29,100 and the price is now consolidating losses. There was a minor upside correction above the $29,250 resistance zone. It cleared the 23.6% Fib retracement level of the downward move from the $29,694 swing high to the $29,100 low.
Bitcoin is now trading below $29,500 and the 100 hourly Simple moving average. There is also a connecting bearish trend line forming with resistance near $29,400 on the hourly chart of the BTC/USD pair.
Immediate resistance is near the $29,360 level. The next major resistance is near the trend line and $29,400. It is close to the 50% Fib retracement level of the downward move from the $29,694 swing high to the $29,100 low. A close above the trend line could start a decent increase toward $29,650.
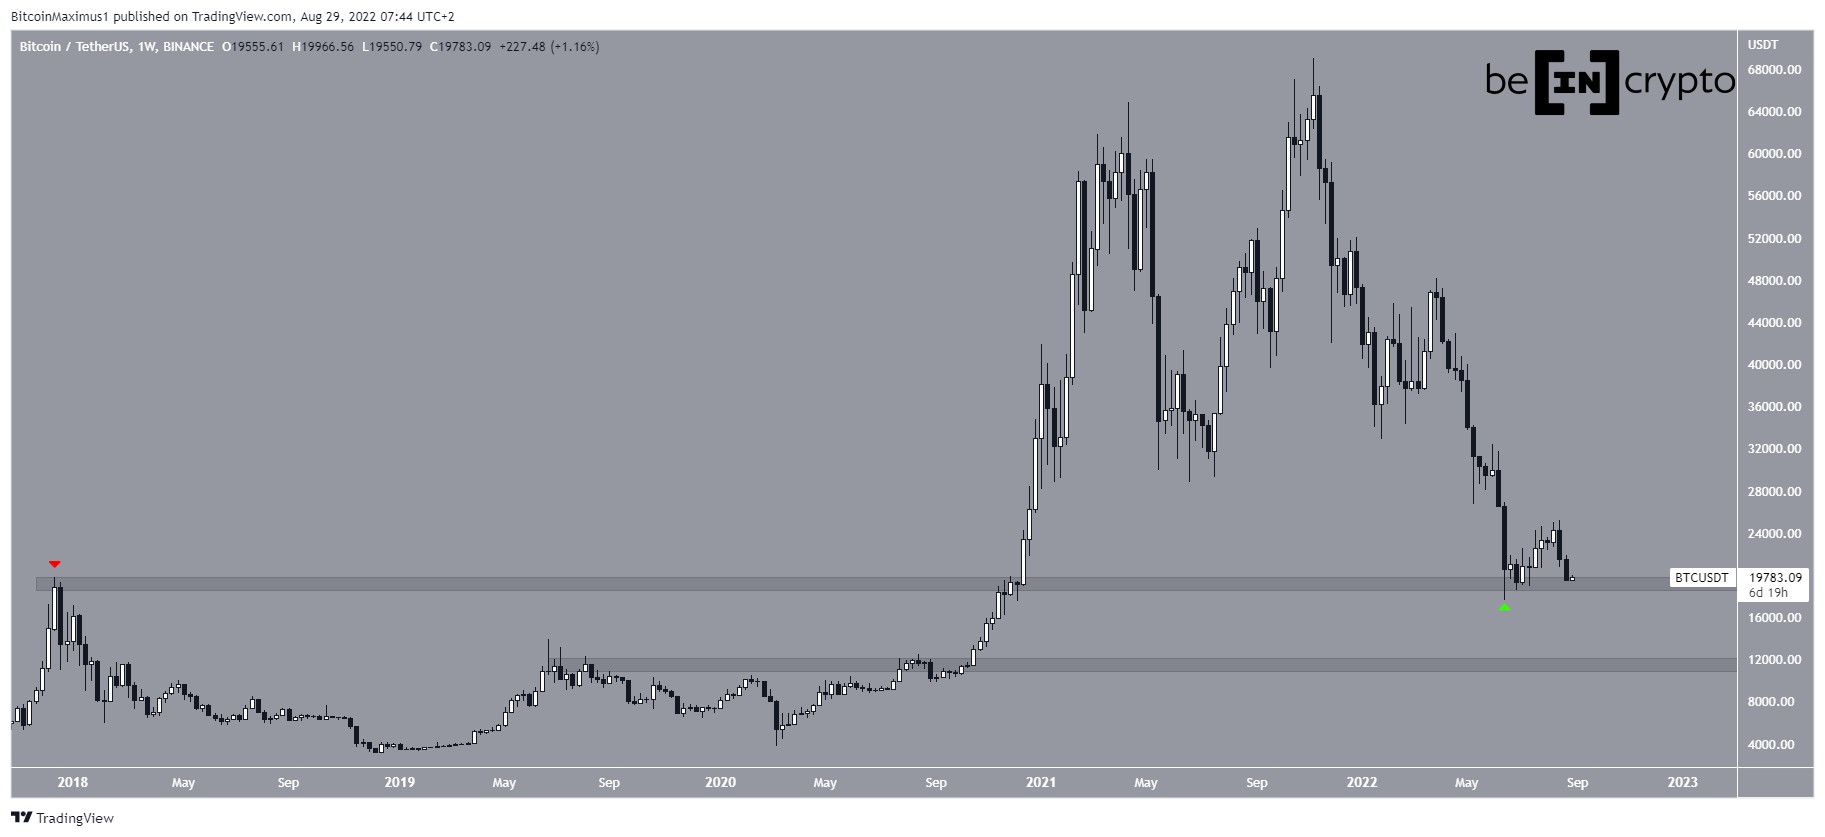
Source: BTCUSD on TradingView.com
The main resistance is still near the $30,000 level. A close above $30,000 could start a steady increase. In the stated case, the price could rise toward $30,500 or even $31,200 in the coming days.
More Losses In BTC?If Bitcoin fails to clear the $29,400 resistance, it could continue to move down. Immediate support on the downside is near the $29,200 level.
The next major support is near the $29,000 level or the recent low. A downside break below the $29,000 level might start another steady decline. In the stated case, the price could revisit $28,800. Any more losses might call for a move toward the $28,500 level in the near term.
Technical indicators:
Hourly MACD – The MACD is now losing pace in the bearish zone.
Hourly RSI (Relative Strength Index) – The RSI for BTC/USD is now below the 50 level.
Major Support Levels – $29,200, followed by $29,000.
Major Resistance Levels – $29,400, $29,650, and $30,000.
origin »Bitcoin price in Telegram @btc_price_every_hour
Bitcoin (BTC) на Currencies.ru
|
|