2021-11-4 14:31 |
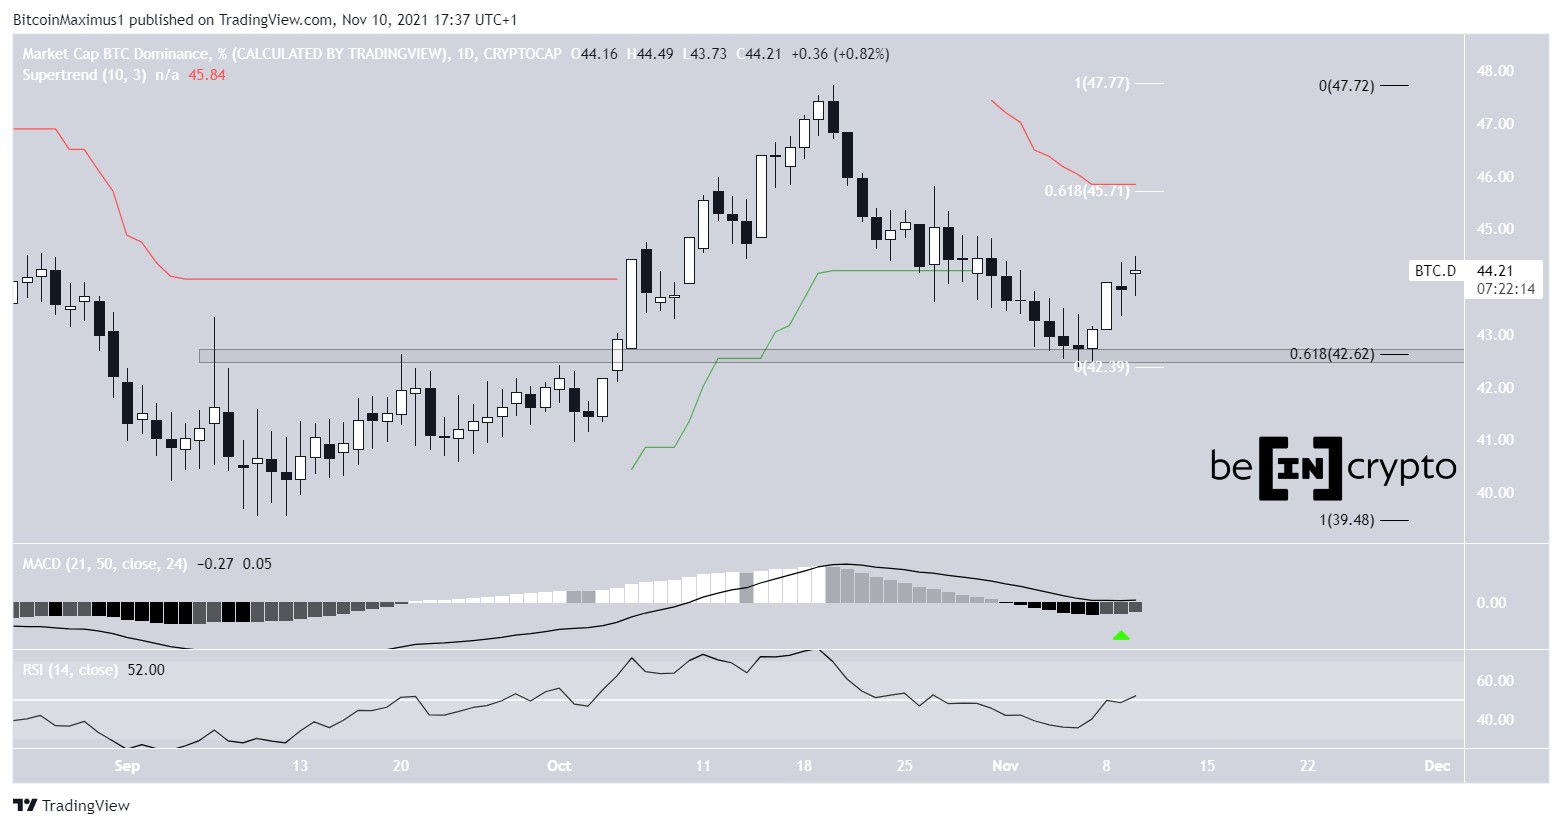
The Bitcoin Dominance Rate (BTCD) is potentially in the beginning stages of a short-term reversal that could cause a strong upward move.
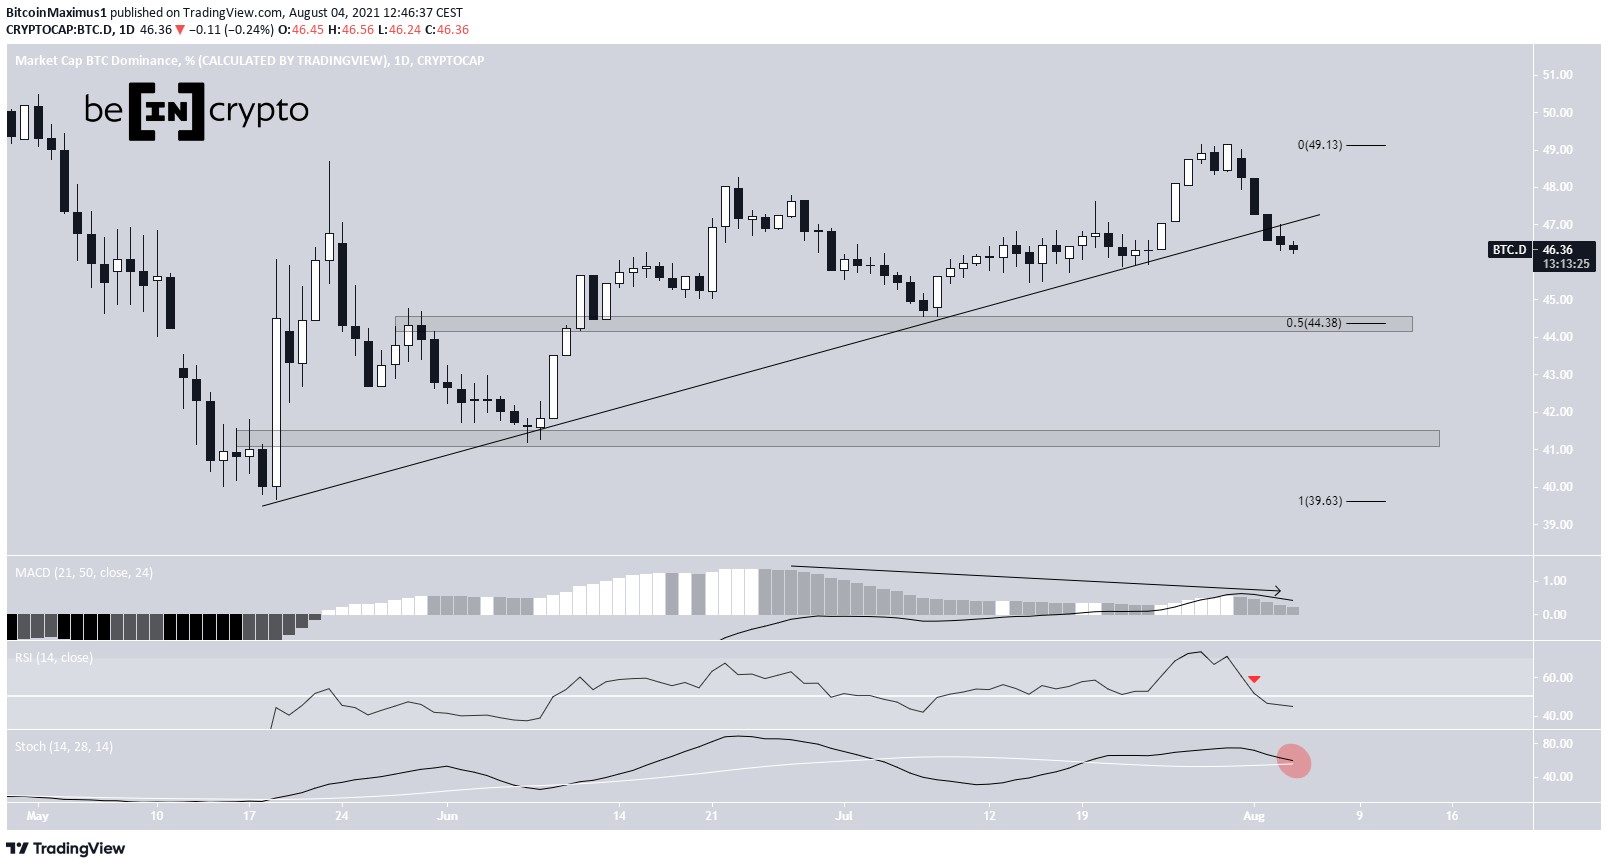
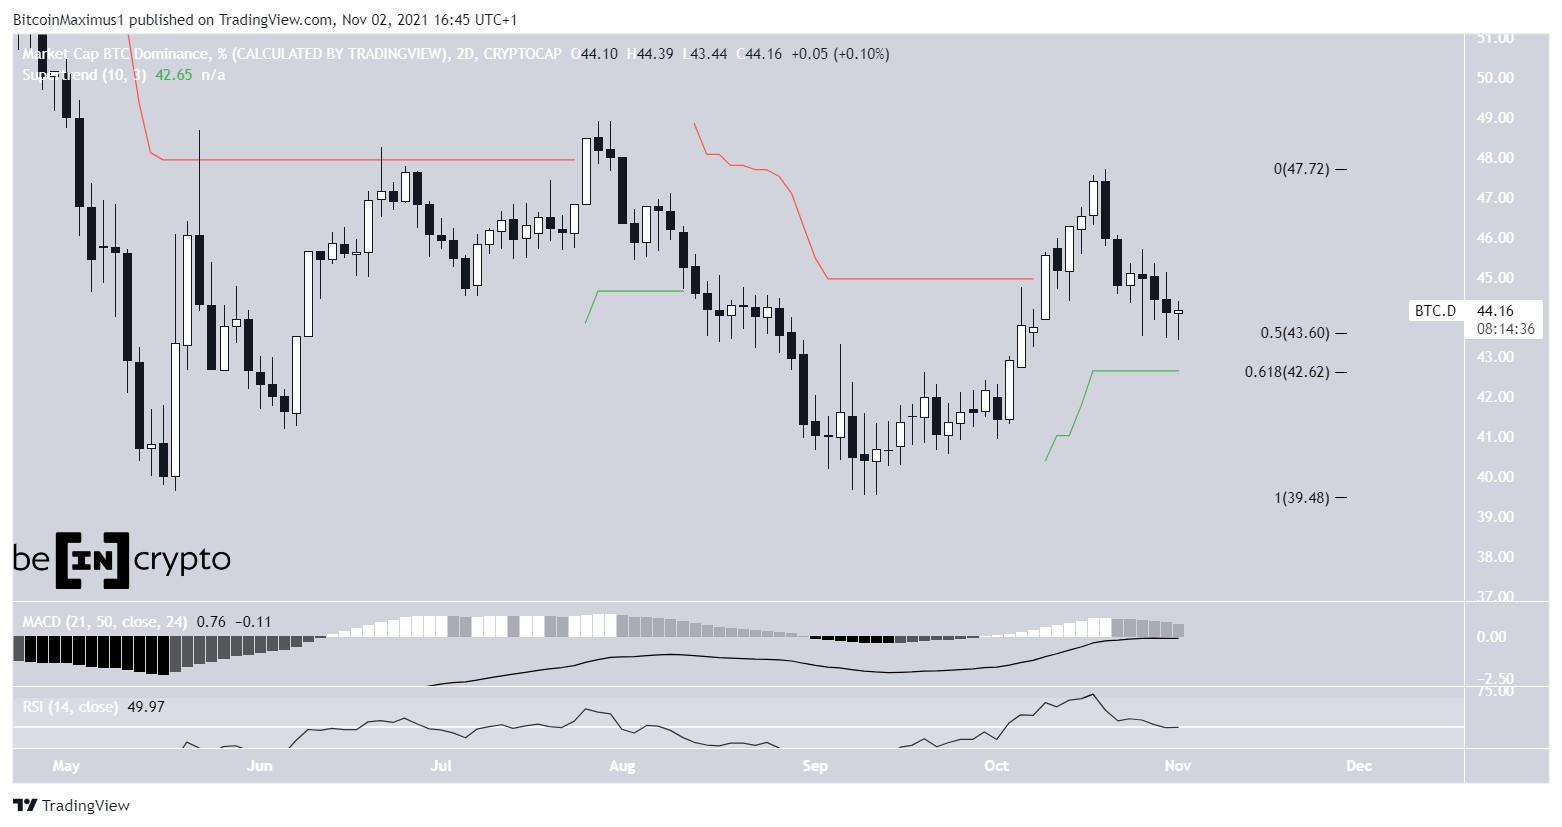
BTCD has been decreasing since Oct 20, after it reached a local high of 47.72%. However, it has seemingly found support at the 0.5 Fib retracement level at 43.60% and bounced.
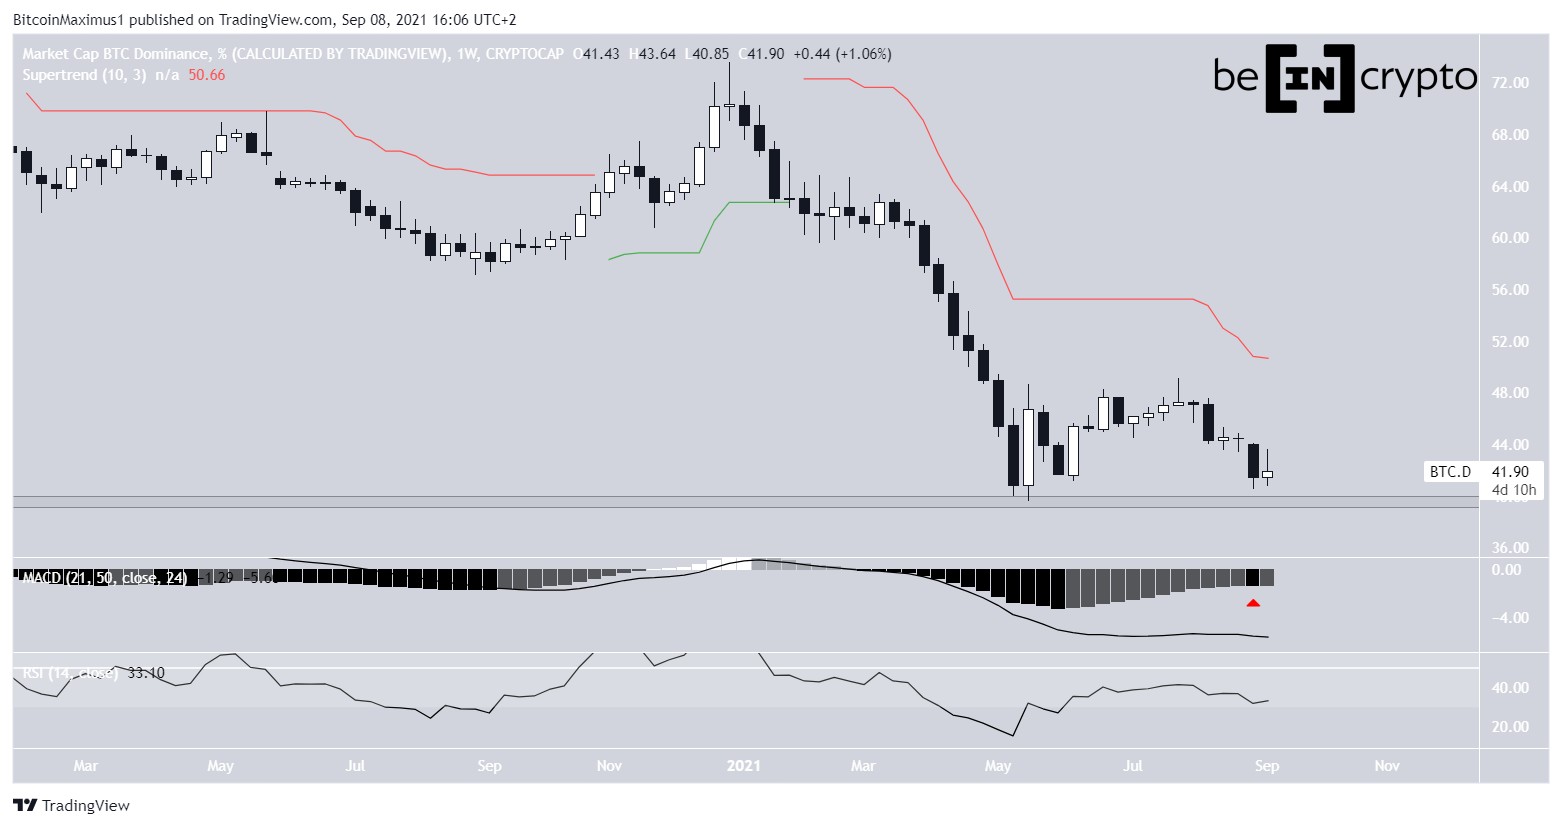
Technical indicators are at a make-or-break level. The MACD is right at the 0-line and is close to crossing into negative territory. This means that the short-term trend is losing speed relative to the long-term one, and is considered a bearish sign. The previous time this occurred was in August 2021 right before a drop to 39.56%.
Similarly, the RSI is currently at the 50-line and could potentially fall below it. The RSI is a momentum indicator and crosses below 50 are often considered to be a switch from a bullish to a bearish trend.
However, the Supertrend is bullish (green line), so we can consider that daily technical indicators are leaning on bullish.
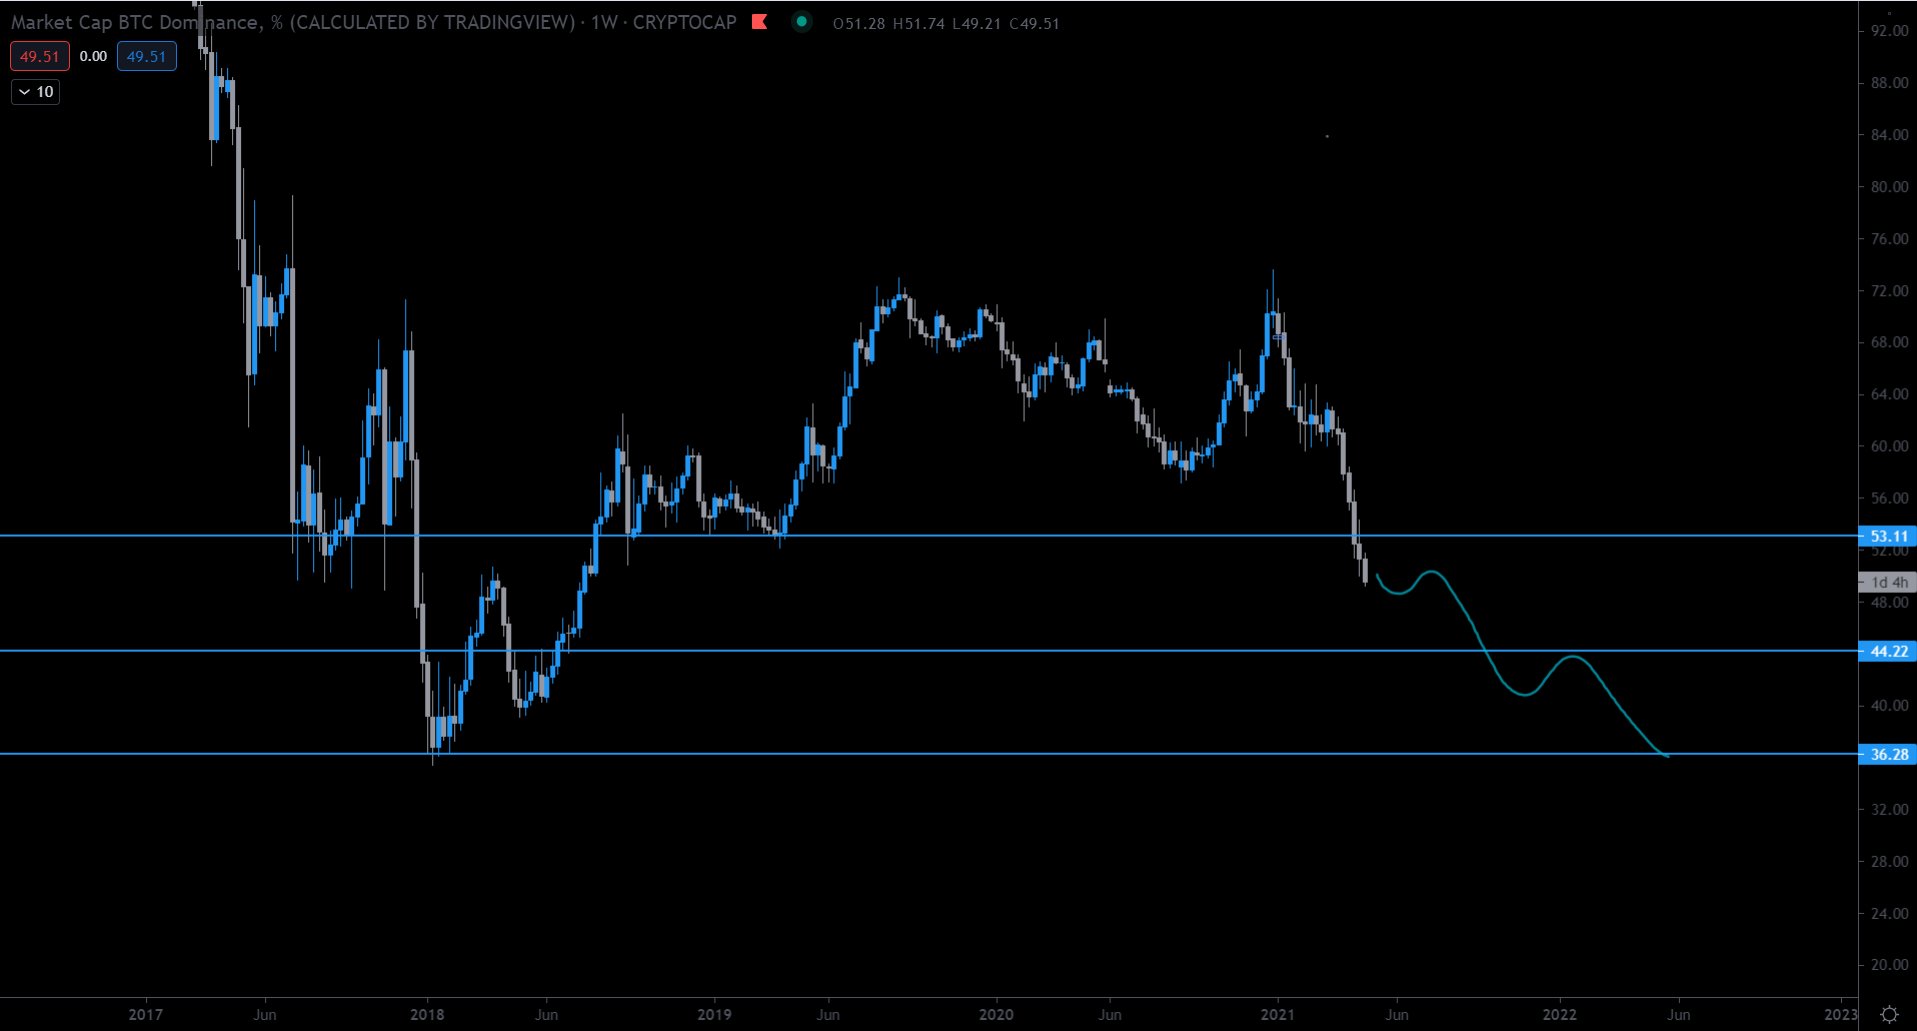
BTCD Chart By TradingView Future movementCryptocurrency trader @Murfski outlined a BTCD chart, stating that it looks close to bottoming and an upward movem is expected to follow.
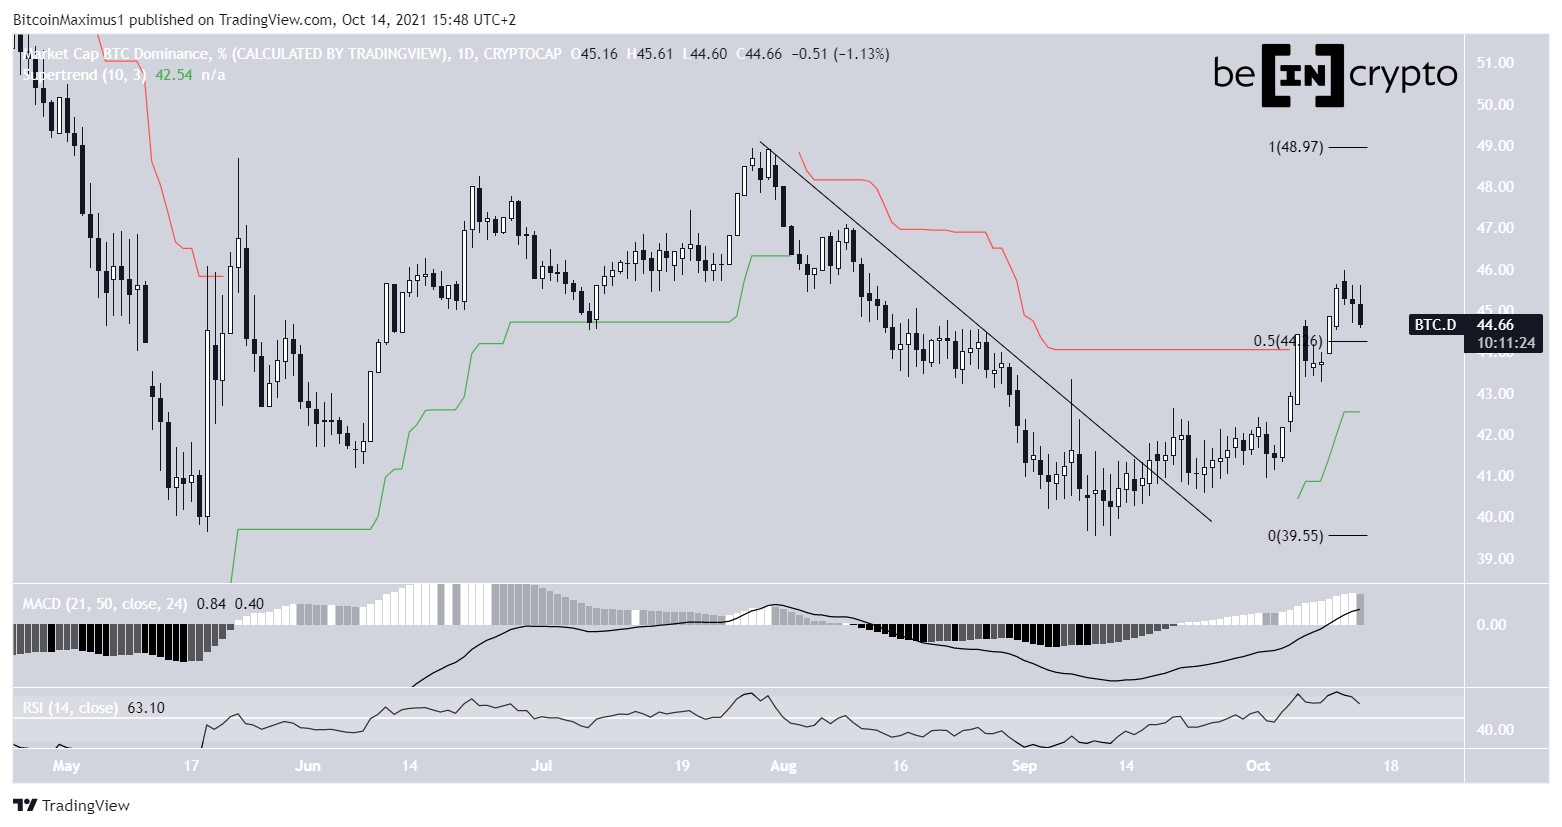
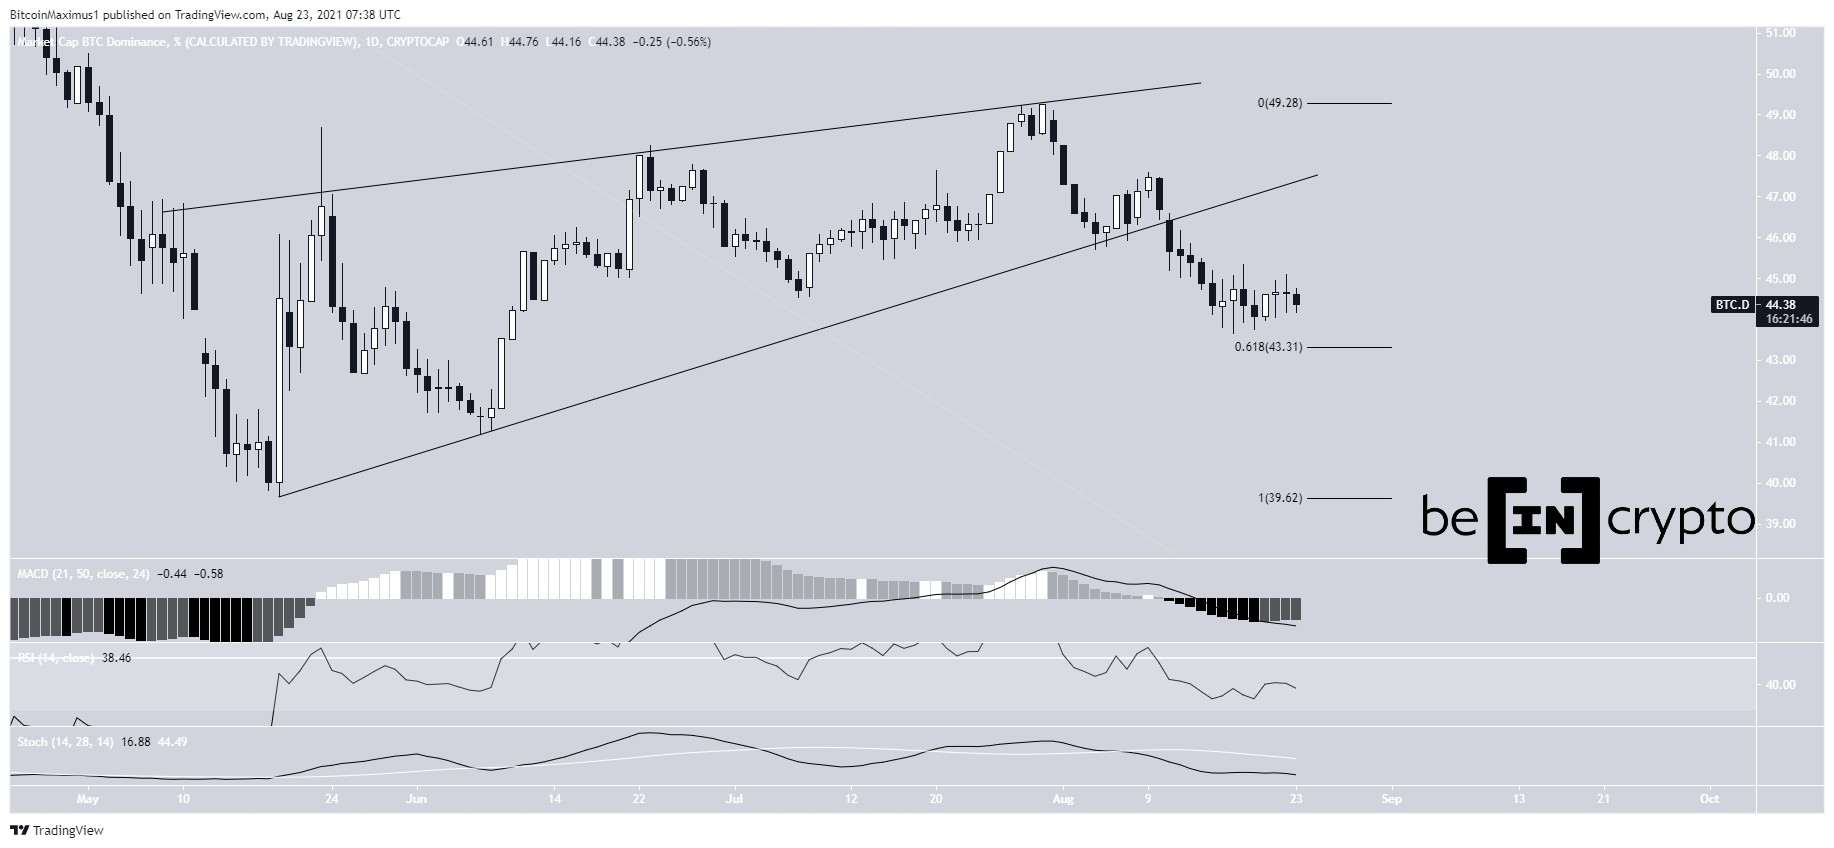
Source: TwitterAs seen above, technical indicators in the daily time frame provide a very mixed outlook. However, the six-hour chart is more bullish.
BTCD is in the process of bouncing from the support line of an ascending parallel channel. As long as the channel is intact, the short-term upward movement is bullish.
Also, both the RSI and MACD have generated bullish divergences. This means that while BTCD values dropped, the decrease became weaker instead of stronger. This movement pattern often precedes trend reversals.
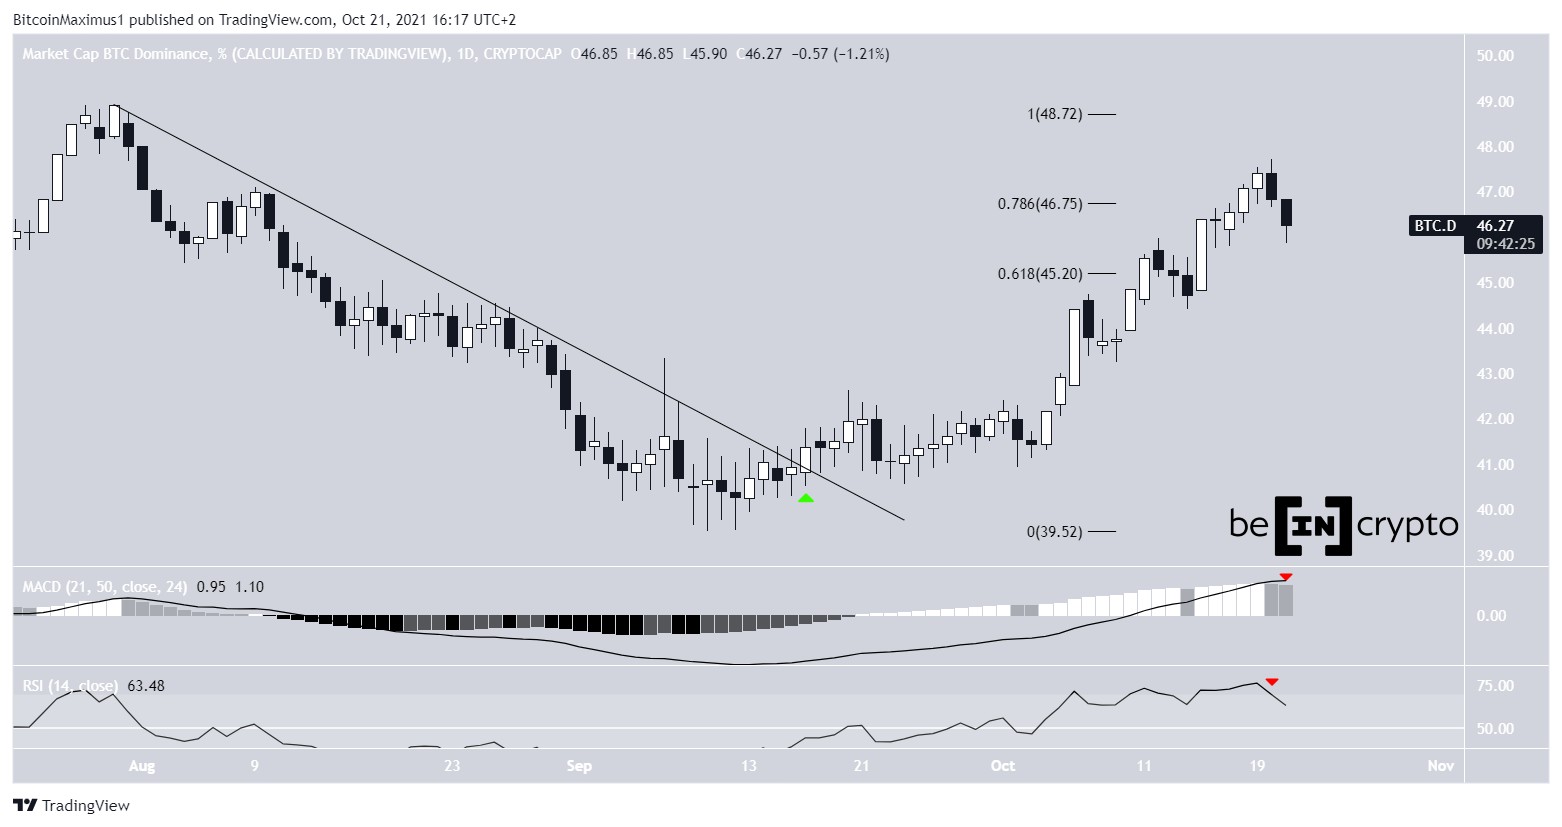
BTCD Chart By TradingViewThe two-hour chart shows strong resistance between 45.2%-45.7%. This is both a horizontal and a Fib resistance level.
If the BTCD manages to clear this resistance range, it would likely move upwards at an accelerated pace.
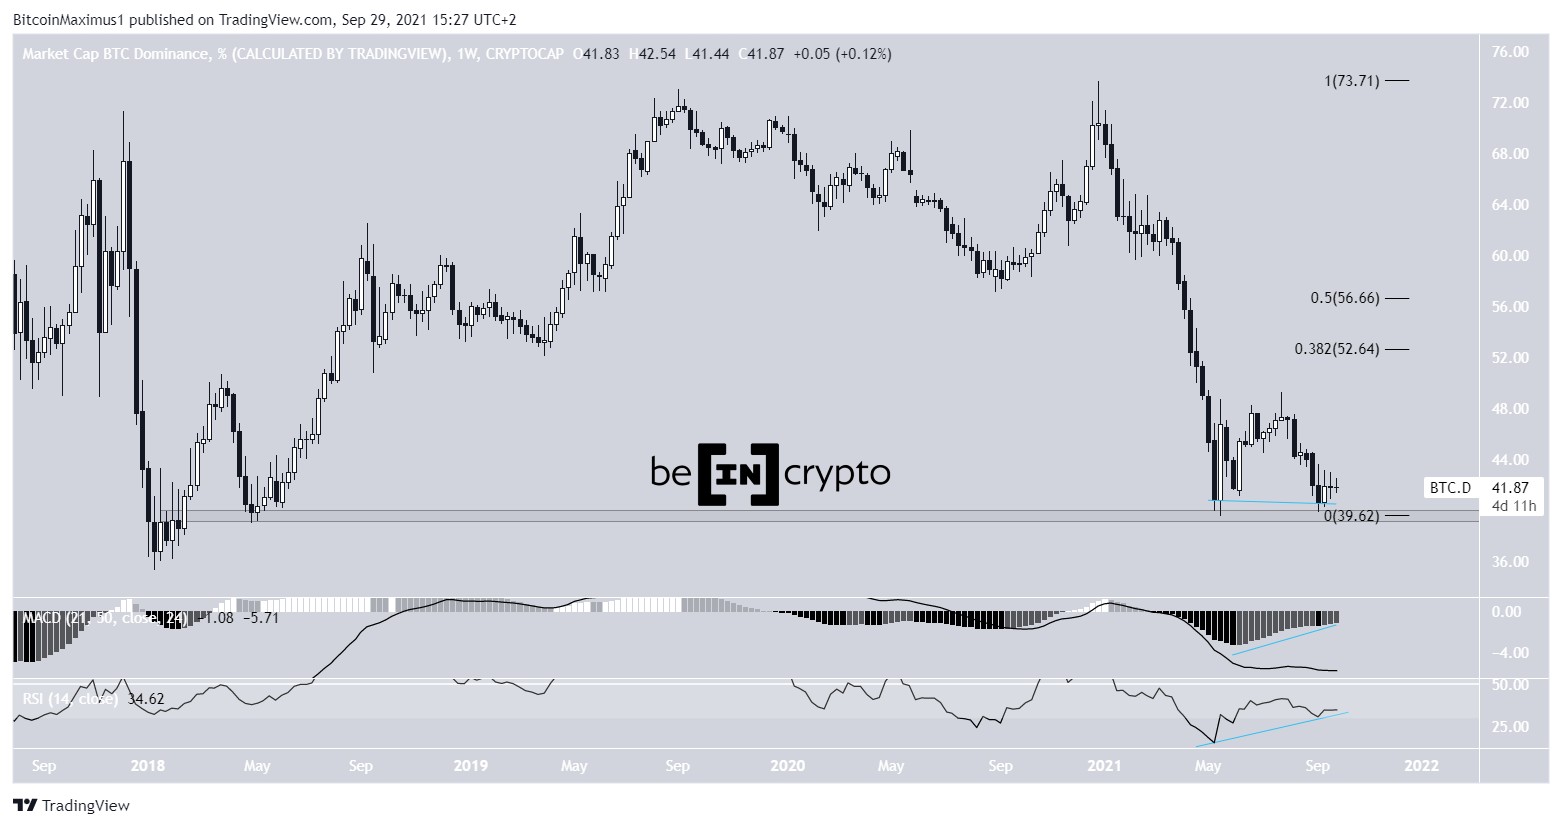
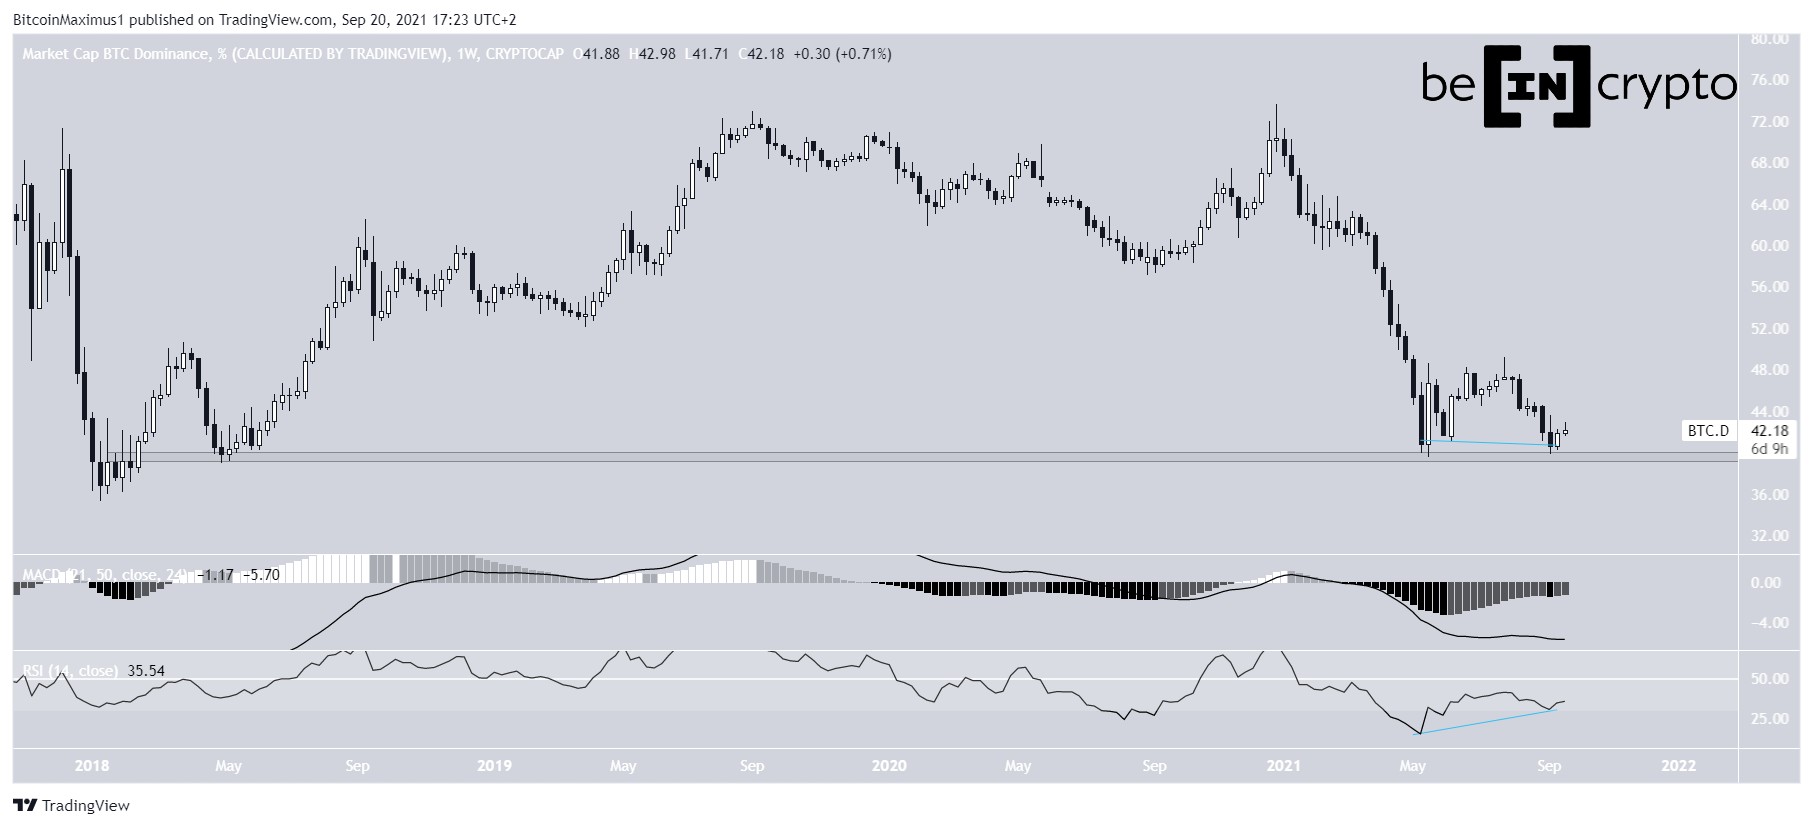
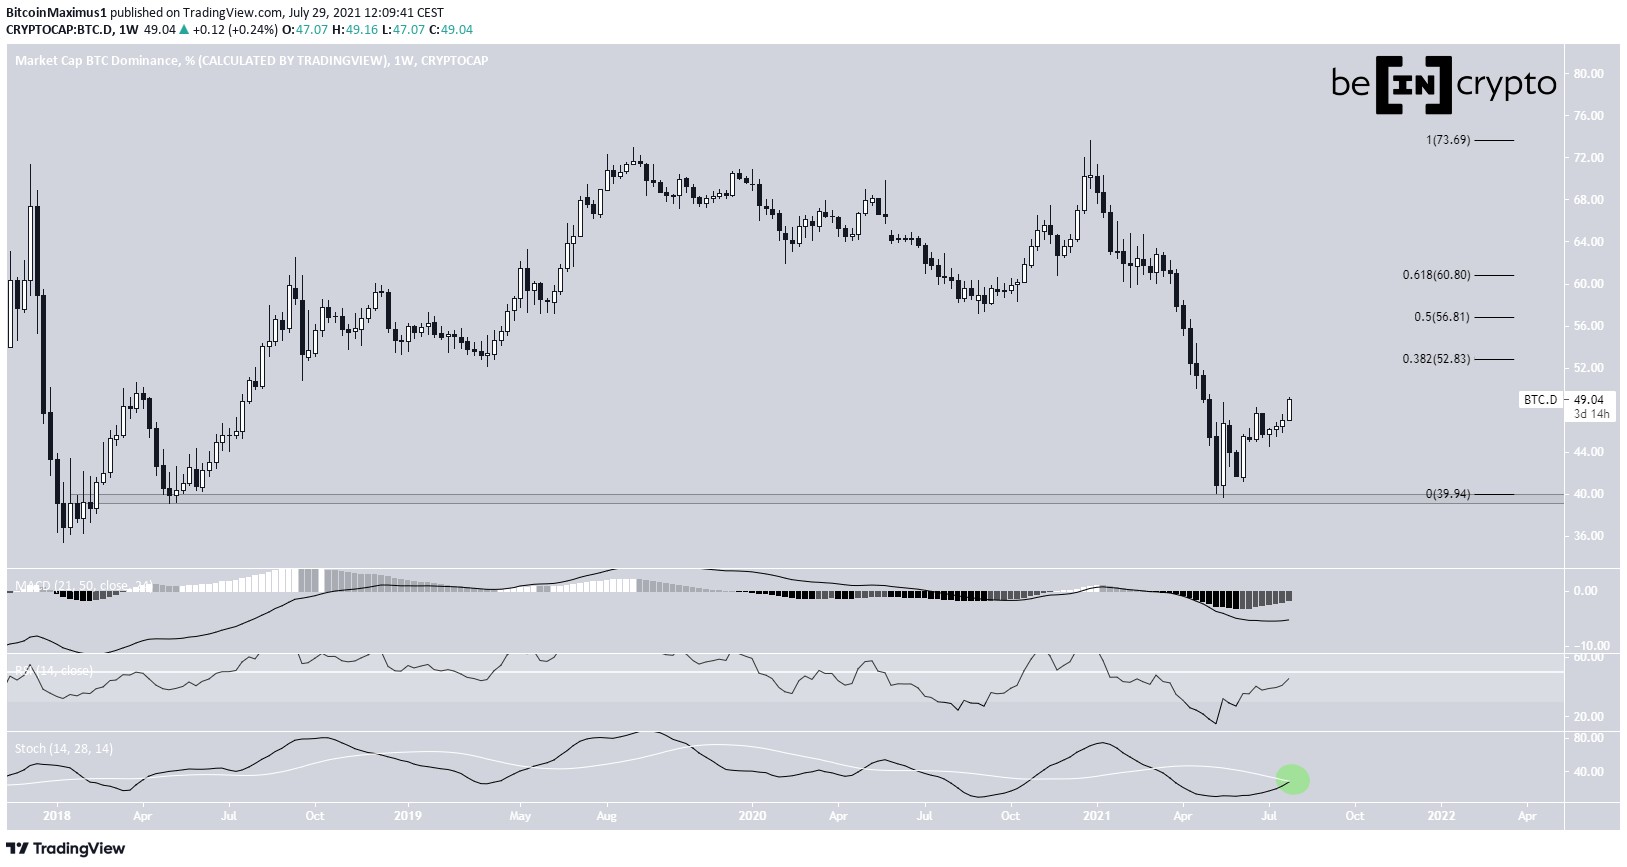
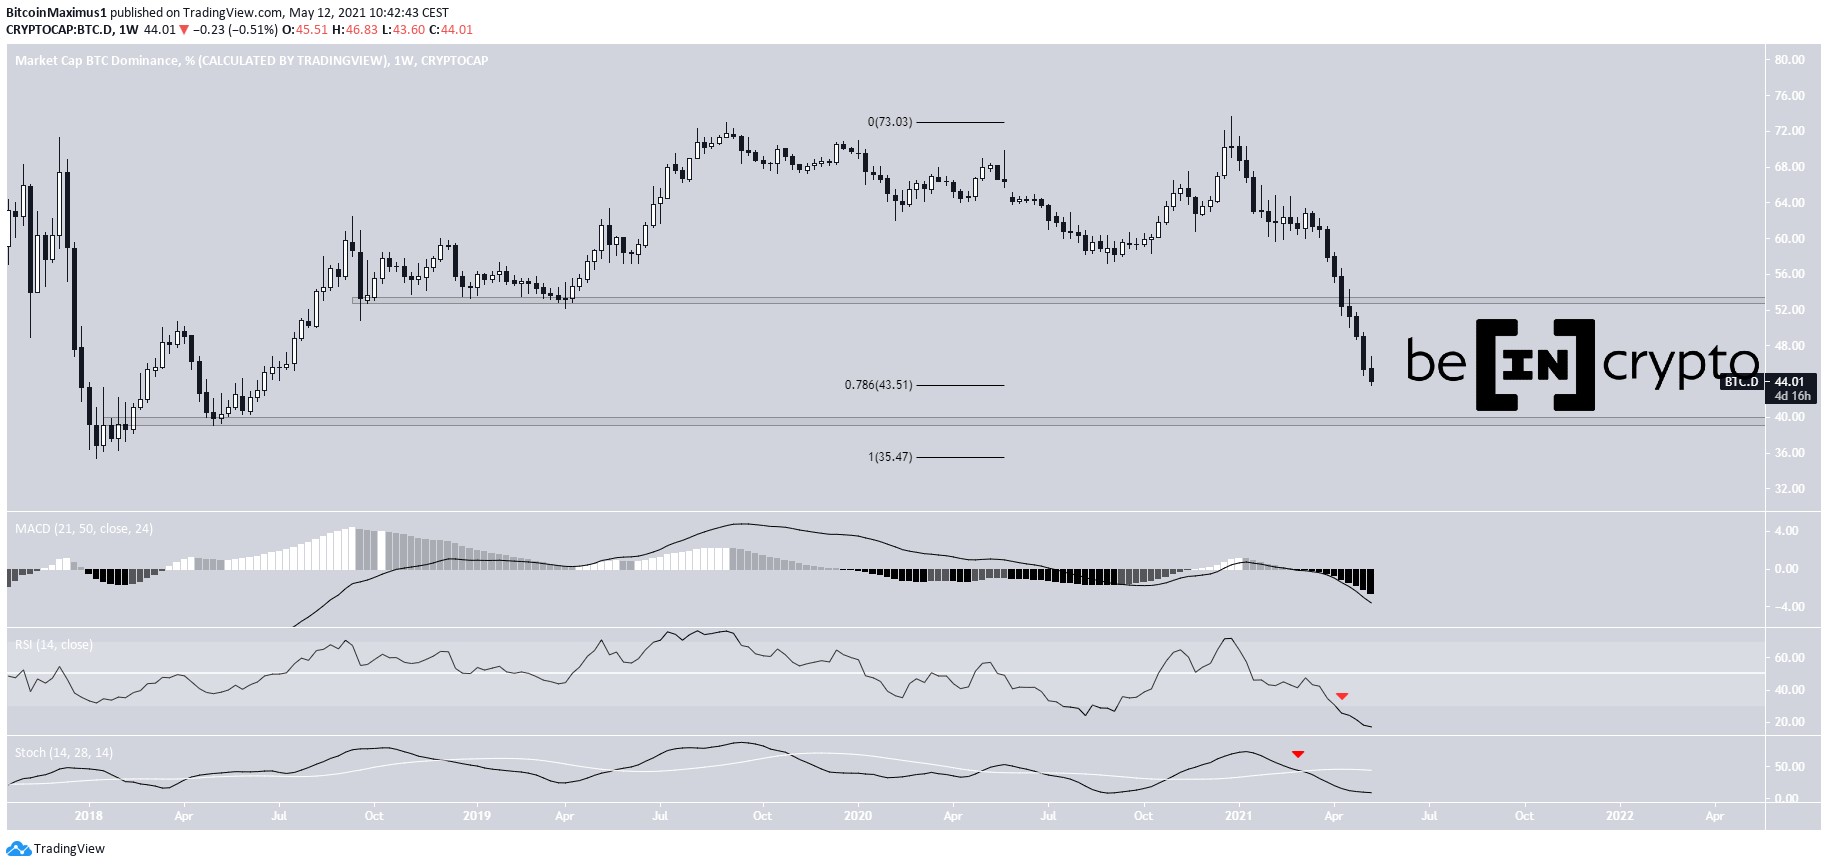
BTCD Chart By TradingView Has BTCD bottomed?The long-term weekly chart shows that BTCD has bounced at the 39.50 horizontal support area. The bounce was preceded by bullish divergence in the RSI. However, the RSI has now generated hidden bearish divergence. While the former usually precedes a bullish trend reversal, the latter often precedes bearish trend reversals.
It remains to be seen if a BTCD increase will invalidate this divergence. In any case, there is a long way to go until the trend can be considered bullish since BTCD has yet to even reach the 0.382 Fib retracement level at 52.65.
However, it does seem like a short-term upward movement awaits.
BTCD Chart By TradingViewFor BeInCrypto’s latest Bitcoin (BTC) analysis, click here.
The post Bitcoin Dominance Rate (BTCD) Fighting to Rebound After Falling From Local High appeared first on BeInCrypto.
origin »Bitcoin price in Telegram @btc_price_every_hour
Bitcoin (BTC) на Currencies.ru
|
|