2021-5-21 17:10 |
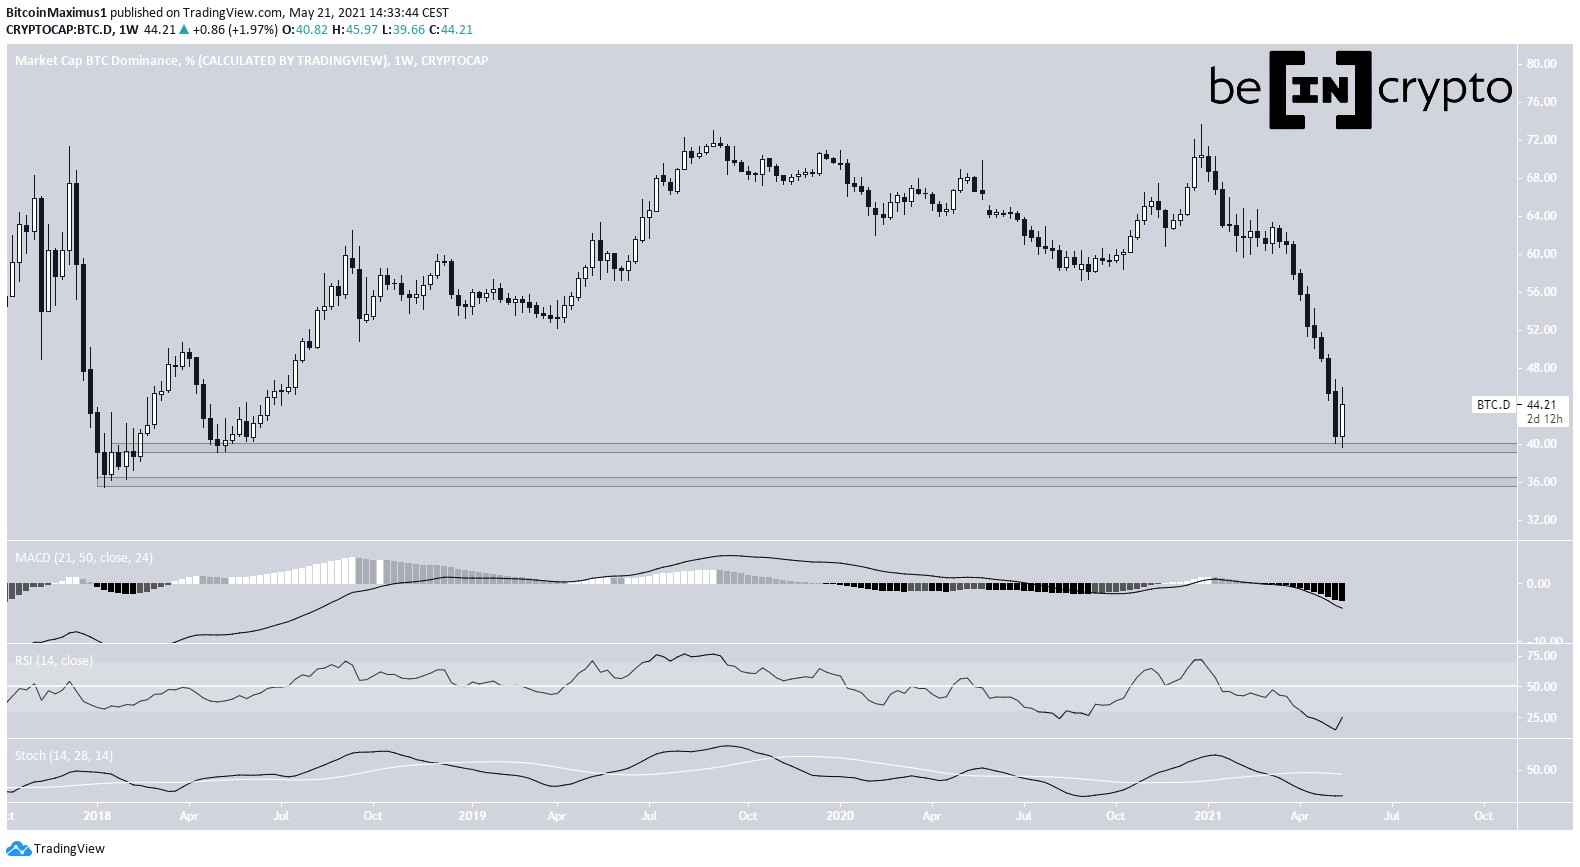
The Bitcoin Dominance Rate (BTCD) fell to 39.66%, on May 19, the lowest level reached since May 2018.
It has begun a bounce, which could take it to the descending resistance line near 50%.
Long-term BTCD decreaseBTCD has been moving downwards since reaching a high of 73.63% in December 2020. So far, it has reached a low of 39.66%, doing so on May 19.
The low was made right at the long-term 39.50% support area, which previously had not been reached since 2018. The next support level is found at 36%.
While a bounce is underway, technical indicators in the weekly time-frame are still bearish. The MACD is negative and decreasing. The Stochastic Oscillator has made a bearish cross and is moving downwards. The RSI has fallen below the 30 line.
Therefore, the long-term trend is still considered bearish.
Chart By TradingView Future movementThe daily chart shows a descending resistance line that has been in place since the aforementioned all-time high price. The line is currently near 50%.
It coincides with the 0.382 and 0.5 Fib retracement levels, which are found at 49% and 52%, respectively.
Unlike the weekly time-frame, technical indicators in the daily time-frame are bullish.
The Stochastic Oscillator has made a bullish cross. The RSI has crossed above 50. The MACD is close to moving into positive territory.
Chart By TradingView Wave countCryptocurrency trader @Thetradinghubb outlined a BTCD chart, showing a wave count that suggests a bounce is likely before another drop.
Source: TwitterThe movement fits with a potential A-B-C structure (white). The sub-wave count is given in orange. Sub-waves 1:3 have a 1:1.61 ratio, common impulses.
Afterwards, a potential bottom for the entire move would be at 30%, which would give waves A:C a 1:2.61 ratio. If it occurs, it would be the lowest value ever recorded for BTCD.
Chart By TradingView Relationship to BTCSince the beginning of May, the relationship between bitcoin (BTC) (orange) and BTCD (candlestick) has been negative. This is visible by the correlation coefficient (red). It means that an increase in the price of one causes an increase in the other.
However, since the May 19 drop, the relationship has turned negative. Therefore, an increase in the BTC price causes a decrease in BTCD.
Chart By TradingViewFor BeInCrypto’s latest bitcoin (BTC) analysis, click here.
The post Bitcoin Dominance Rate Bounces After Prolonged Correction appeared first on BeInCrypto.
origin »Bitcoin price in Telegram @btc_price_every_hour
Bitfinex Bitcoin Dominance Perps (BTCDOM) на Currencies.ru
|
|


