2021-3-25 10:31 |
The Bitcoin (BTC) price decreased considerably on March 24, reaching the $52,500 support area.
Bitcoin is expected to bounce at either the current level or at the $50,250 support.
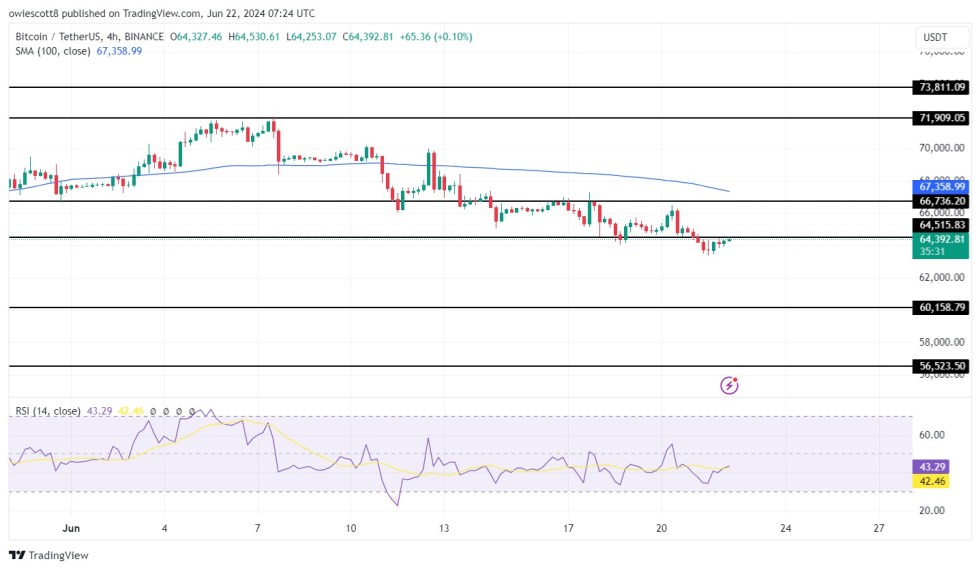
Bitcoin Falls to SupportBTC made an attempt at an upward movement yesterday but ended up closing with a very long upper wick. In addition, the daily candlestick had a bearish close on the daily time-frame.
Currently, Bitcoin is trading just above support at $52,500. This is the 0.5 Fib retracement level of the entire upward movement.
The next closest support level is found at $50,250. This is the 0.618 Fib retracement level and also a horizontal support area. Therefore, if Bitcoin falls back to this support, a bounce would be expected.
Technical indicators in the daily time-frame are firmly bearish. The MACD is in negative territory, the RSI has crossed below 50, and the Stochastic oscillator has made a bearish cross.
BTC Chart By TradingView Short-Term MovementThe two-hour chart is a bit more bullish. Despite the price making a lower low, both the MACD and RSI have generated bullish divergences. This is a sign of a potential bounce.
In addition, we can see that the current drop is a perfect retest of the highs seen between Feb. 25 and March 3.
At least in the short-term, a bounce is expected. Since Bitcoin is also trading at long-term support, this could develop into a longer-term move.
BTC Chart By TradingView Will Bitcoin Reverse Trend?A closer look shows that Bitcoin is trading inside a parallel descending channel. This pattern often contains a corrective movement. Therefore, a breakout from the channel would be expected at the conclusion.
However, the exact slope of the channel is not clear. BTC is either at the support line of the channel (black) or is approaching it. The support line is located near $50,250. Both scenarios seem possible since $50,250 is also a strong support level.
When measuring the first part of the decrease, we can see that the second portion had an exact 1:1 ratio. Since BTC is also trading at a horizontal level, and there are multiple divergences in place, it’s more likely that Bitcoin has reached a low and will bounce from here.
BTC Chart By TradingView ConclusionIt’s likely that Bitcoin has already reached a low and will now move upwards. A bearish scenario could see BTC dropping towards $50,250 before potentially bouncing back.
In any case, the ongoing drop does not look like the beginning of a bearish impulse.
For BeInCrypto’s previous Bitcoin (BTC) analysis, click here.
The post Bitcoin (BTC) Drops to ‘Make or Break’ Support Level appeared first on BeInCrypto.
origin »Bitcoin price in Telegram @btc_price_every_hour
Bitcoin (BTC) на Currencies.ru
|
|