Bitcoin (BTC) Blasts Through $11,000 Following Bullish Triangle Breakout

2020-10-9 14:28

Bitcoin price just smashed back above $11,000 and bulls are now attempting to flip the key level as resistance turned support. The move comes following the breakout of a triangle pattern, and a sudden reappearance of weakness in the dollar’s now short-lived recovery. But the question is, how far will this rally go?

Bitcoin Price Reclaims $11,000, But Can Bulls Hold It This Time?

The leading cryptocurrency by market cap has now spent three days in the green. Yesterday, Bitcoin broke upward from a triangle pattern forming on daily timeframes.

The triangle was believed to be a bearish pennant following a head and shoulders reversal pattern. But after $10,000 was so valiantly defended by bulls for seven consecutive days, it may be the last time Bitcoin ever trades below five-digits.

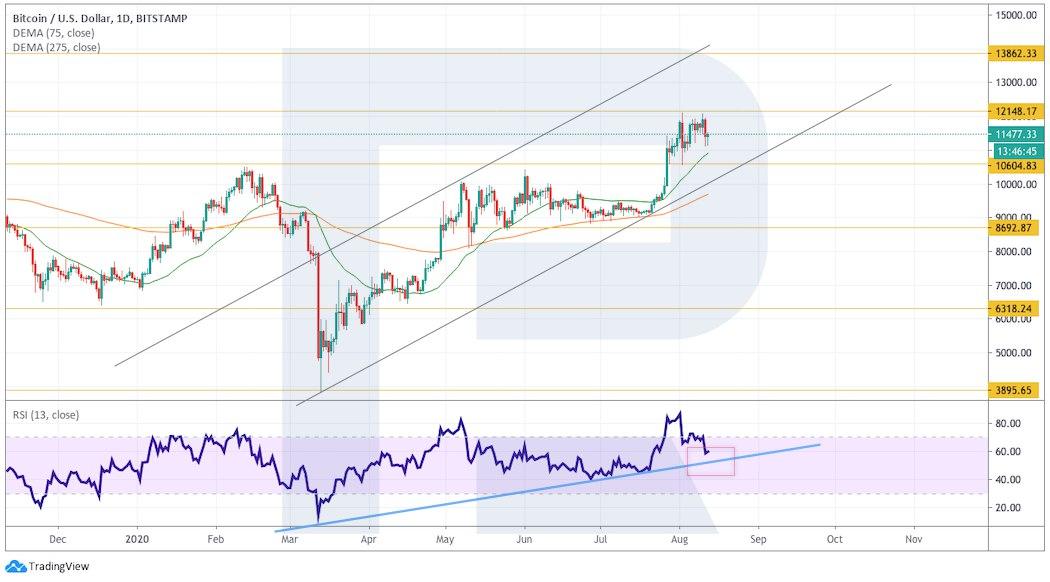
BTCUSD Daily Triangle Breakout And Potential Target | Source: TradingView

Utilizing the measure rule, the potential target of the triangle is somewhere closer to $12,000 than, $11,000, so Bitcoin has a lot more to run.

Roughly a 10% move could be expected considering the pattern’s height, taking the first-ever cryptocurrency to around $11,850 before it challenges its next highest resistance level.

Related Reading | Analyst: Sidelined Capital Enough To Push Bitcoin To $1 Trillion Market Cap

A push beyond local 2020 highs around $12,000 will likely result in a retest of $13,800 where 2019’s top lies. Beyond there, could be the retest of $20,000 the crypto world has been waiting for.

Featured image from Deposit Photos, Charts from TradingView

Similar to Notcoin - TapSwap on Solana Airdrops In 2024

origin »

Breakout (BRK) на Currencies.ru

$ 0.0052035 (+0.00%)
Объем 24H $0
Изменеия 24h: 0.00 %, 7d: -49.08 %
Cегодня L: $0.0052035 - H: $0.0052035
Капитализация $98.602k Rank 99999
Доступно / Всего 18.949m BRK

triangle breakout bitcoin following comes support resistance

triangle breakout → Результатов: 126


Analyzing Bitcoin’s Symmetrical Triangle Trading Range

Bitcoin (BTC) looks to be approaching the end of its consolidation inside a symmetrical triangle pattern. A breakout or rejection from this level will be crucial in determining the future trend. Bitcoin Inside Symmetrical Triangle The Bitcoin price has been trading inside a symmetrical triangle since reaching a local low of $9,825 on Sept 8.

2020-10-7 13:37


Фото:

A Bitcoin Breakout could Carry BTC to a Crucial Resistance Level

The Bitcoin price has been gradually increasing since it reached a low of $8,910 on June 15. It is currently trading inside a symmetrical triangle, out of which a breakout is expected. After creating a bullish hammer with significant volume on June 15, the Bitcoin price has created another bullish candlestick, albeit much smaller and […] The post A Bitcoin Breakout could Carry BTC to a Crucial Resistance Level appeared first on BeInCrypto.

2020-6-18 14:35


Фото:

Is Bitcoin Moving in an Ascending Triangle or Wedge?

On April 2, the Bitcoin price initiated a very swift upward move, rallying from a low of $6,551 to a high of $7,194. While initially, it seemed that this movement would cause a breakout above the current pattern, the higher prices could not be sustained and BTC reached a close of $6,794, slightly below the […] The post Is Bitcoin Moving in an Ascending Triangle or Wedge? appeared first on BeInCrypto.

2020-4-3 13:45


Фото:

Bitcoin Breaks Out Above Resistance — Is $8,000 Just Around the Corner?

On April 1, the Bitcoin price initiated an upward move that caused it to break out above its descending resistance line and with it the symmetrical triangle it had been trading in since March 20. Bitcoin Price Breakout Last night, the Bitcoin price broke out from the possible symmetrical triangle it has been trading in […] The post Bitcoin Breaks Out Above Resistance — Is $8,000 Just Around the Corner? appeared first on BeInCrypto.

2020-4-2 12:53


Binance Coin Price Analysis BNB / USD: Upbeat

Binance Coin (BNB) remains bearish over the short and the medium-term horizon The four-hour time shows that a bullish breakout has occurred from an ascending triangle pattern A bearish death-cross is still underway on the daily time frame Binance Coin is on the rise, after the cryptocurrency staged a powerful double-digit rally alongside the recent […] The post Binance Coin Price Analysis BNB / USD: Upbeat appeared first on Crypto Briefing.

2019-10-10 16:59


Stellar Lumen Price Analysis XLM / USD: Turning Point

Stellar Lumen remains technically bearish across the short and medium-term The four-hour time frame shows that a bearish breakout from an ascending triangle pattern is underway The daily frame continues to show a head and shoulders pattern in play Stellar Lumen is attempting to build on recent trading gains, after the cryptocurrency recovered nearly thirty […] The post Stellar Lumen Price Analysis XLM / USD: Turning Point appeared first on Crypto Briefing.

2019-10-2 17:58


Фото:

Bitcoin Price In ‘Descending Triangle’ As Brandt Reveals Long Positions

Bitcoin price is in the “definition” of a descending triangle but the potential for upside remains, veteran trader Peter Brandt has said in fresh advice for investors. Brandt Urges Caution On Short-Term Bitcoin In a series of social media updates on September 7, Brandt, who is well known as a bullish Bitcoin proponent, said that while downward pressure was evident, a breakout could still occur.

2019-9-10 14:00


Фото:

Bitcoin Price Analysis: $10,000 Sees Bulls Accumulating

Since the recent drop from $11,000 t0 $9,800 as outlined in my previous analysis on BTC, price levels have created an asymmetrical triangle and will see a breakout next week. Bitcoin 1-Hour Analysis On the 1 hour chart for XBT/USD, we can see the asymmetrical triangle highlighted after the breakdown from the rising wedge as mentioned in my previous analysis on Bitcoin.

2019-8-27 20:14


Cardano Price Analysis ADA / USD: Taking The Leap

Cardano is preparing for a short-term technical breakout from a neutral triangle pattern on the four-hour time frame The popular cryptocurrency remains technically weak across the medium-term horizon Cardano has opened the new trading weaker under renewed downside pressure and is currently the worst performing cryptocurrency inside the top twenty cryptocurrencies by market capitalization.

2019-8-27 16:09


Cardano Price Analysis ADA / USD: Heading Down

Cardano has a bearish short-term trading outlook, with the ADA / USD pair falling to its lowest level since March 2019 The four-hour time frame is showing that a strong bearish breakout from a triangle pattern has occurred The daily time frame shows an invalidated inverted head and shoulders pattern Cardano / USD Short-term price […] The post Cardano Price Analysis ADA / USD: Heading Down appeared first on Crypto Briefing.

2019-8-15 17:16


Ethereum Price Analysis ETH / USD: Extensive Losses

Ethereum has a bearish short-term bias, with the ETH / USD pair crashing below key technical support on the four-hour time frame The four-hour time frame shows that the recent bearish triangle breakout has accelerated the ETH / USD pair’s decline The daily time frame shows that the bearish head and shoulders pattern is close […] The post Ethereum Price Analysis ETH / USD: Extensive Losses appeared first on Crypto Briefing.

2019-8-15 16:16