2021-11-26 22:30 |
If it manages to hold on above the current support level, Solana (SOL) could initiate a significant upward movement that takes it to a new all-time high and beyond.
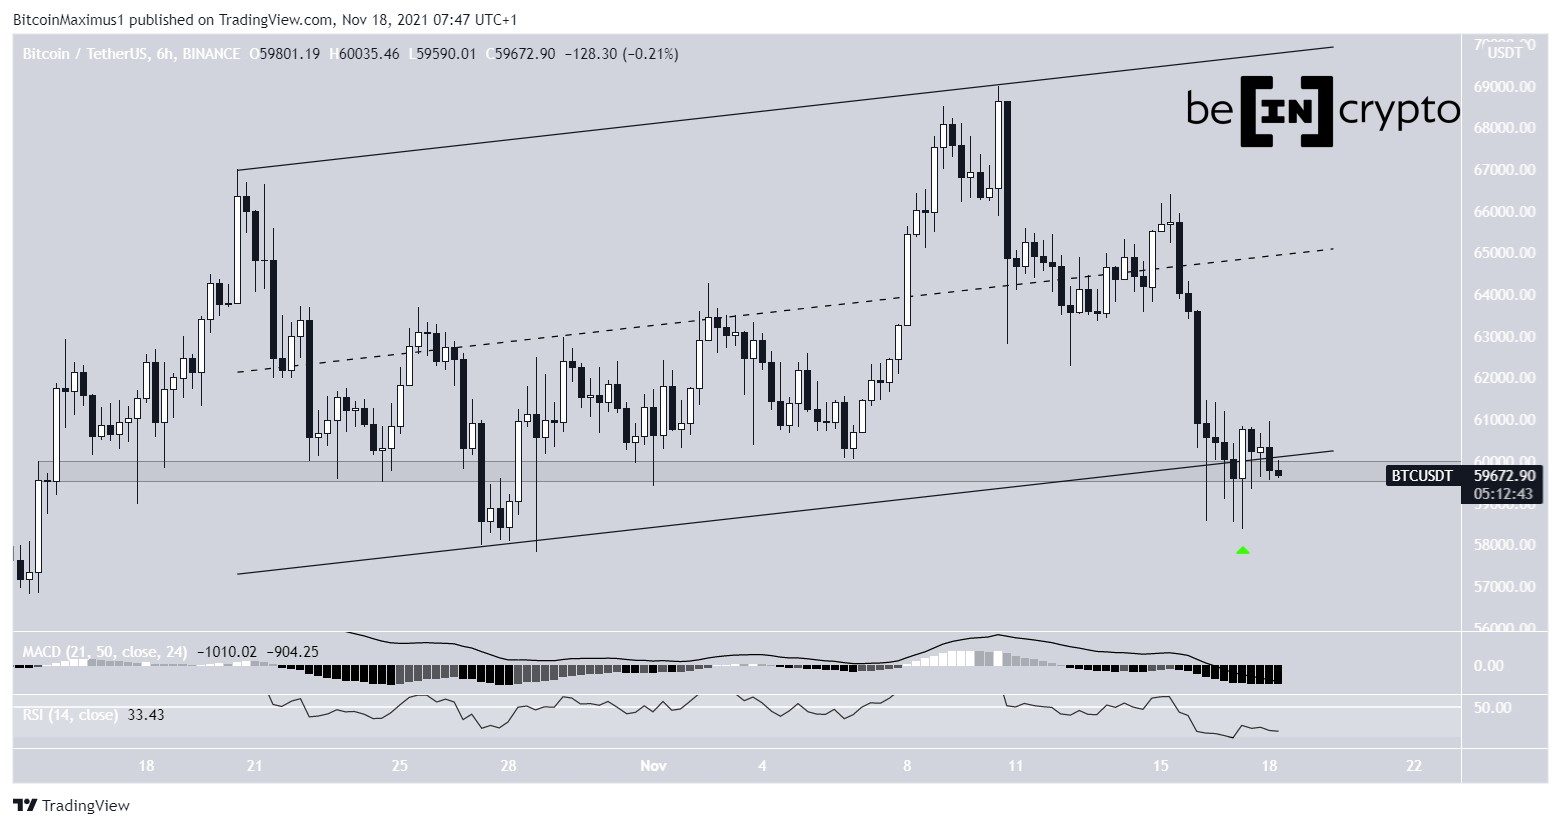
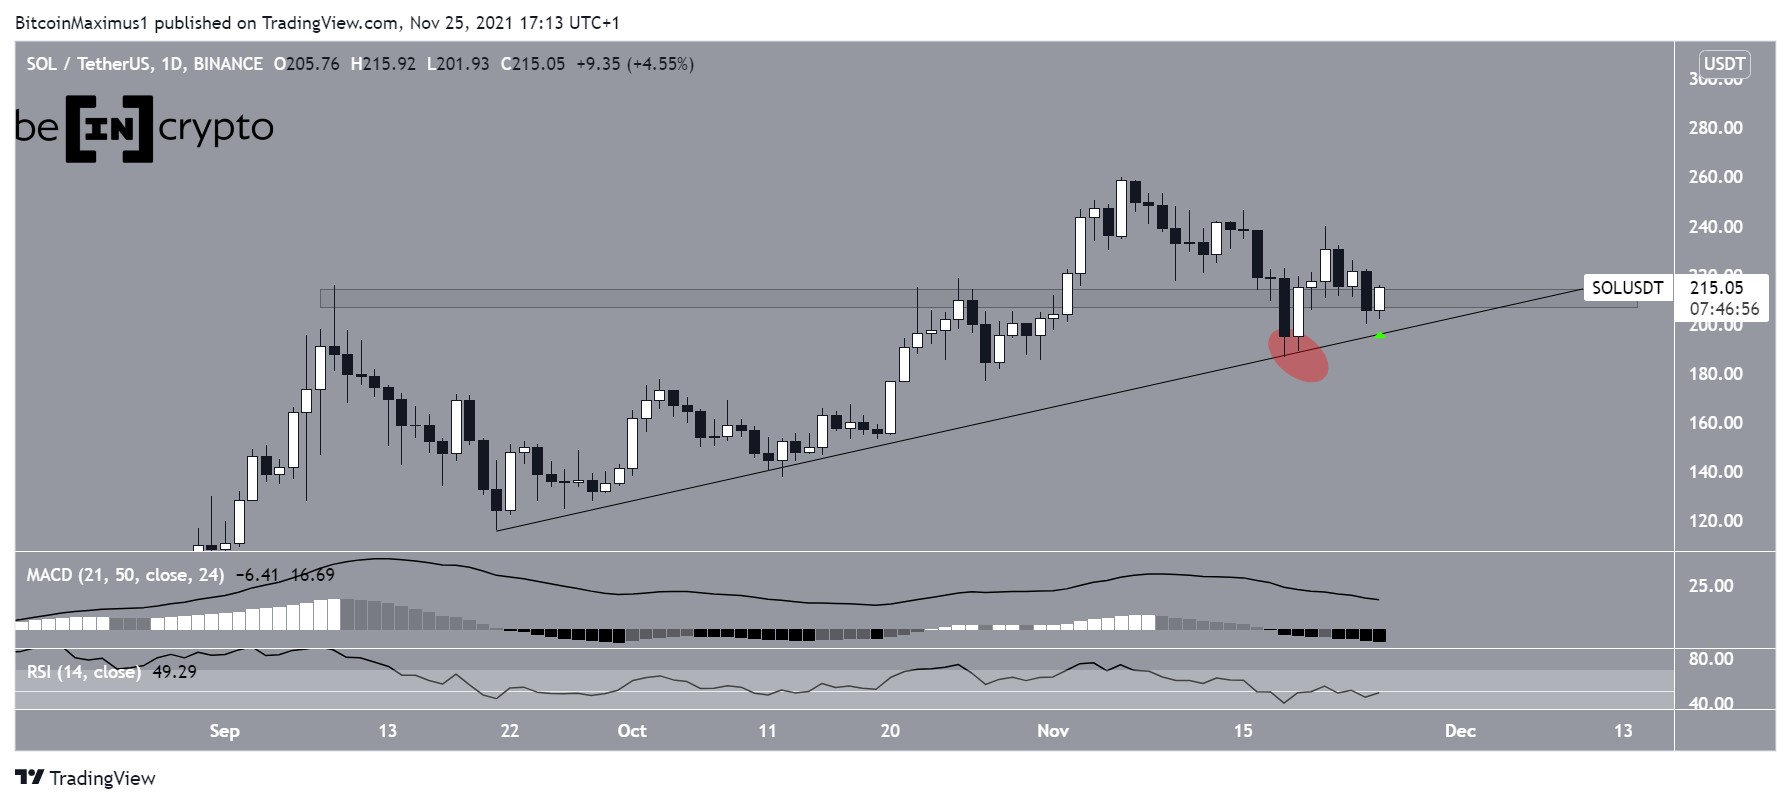
On Nov 18, SOL reached a low of $186.50 (red circle). It seemed that the token had broken down below the $210 area, which was expected to act as support.
However, SOL bounced afterwards and reclaimed the area. The bounce also served to validate an ascending support line, which has been in place since Sept 16.
On Nov 24, the token created a higher low (green icon), bouncing at the confluence of the $210 area and the ascending support line.
However, despite the increase, technical indicators are neutral.
The MACD, which is created by a short- and a long-term moving average, is decreasing. This means that the short-term MA is gradually losing ground to the long-term one, meaning that the trend is decelerating. However, the fact that it is still positive is a bullish sign, which shows that the short-term MA is still faster.
The RSI, which is a momentum indicator, is right at the 50 line. This is a sign of a neutral trend.
Therefore, a look at lower time-frame is required in order to determine the direction of the trend.
Chart By TradingView Short-term movementThe shorter-term six-hour chart shows that SOL has been decreasing alongside a descending resistance line since Nov 5. More recently, it was rejected by the line on Nov 23.
The token is currently gearing up for another attempt at breaking out. However, there is strong resistance at $232. This is the :
0.618 Fib retracement resistance level Horizontal resistance area Descending resistance lineA breakout above this level would confirm that the correction is over.
Chart By TradingView SOL wave countCryptocurrency trader @CryptoTony_ tweeted a SOL chart, stating that the token could increase towards $400 and potentially $600.
Source: TwitterDue to the overlap between the Nov 10 low and Nov 21 high (red icons), it seems that the decrease was corrective. Therefore, it means that the trend is bullish and the downward movement was part of a correction.
Chart By TradingViewTherefore, it is likely that the decrease was wave two of a five wave upward movement. In this case, SOL is just beginning wave three, which is usually the sharpest out of the five.
If correct, the targets outlined in the tweet would be attainable at either the top of wave three or wave five.
Chart By TradingViewFor BeInCrypto’s latest Bitcoin (BTC) analysis, click here.
The post Solana (SOL) Reclaims Previous All-Time High Resistance appeared first on BeInCrypto.
origin »Bitcoin price in Telegram @btc_price_every_hour
Sola (SOL) на Currencies.ru
|
|