2021-5-30 12:58 |
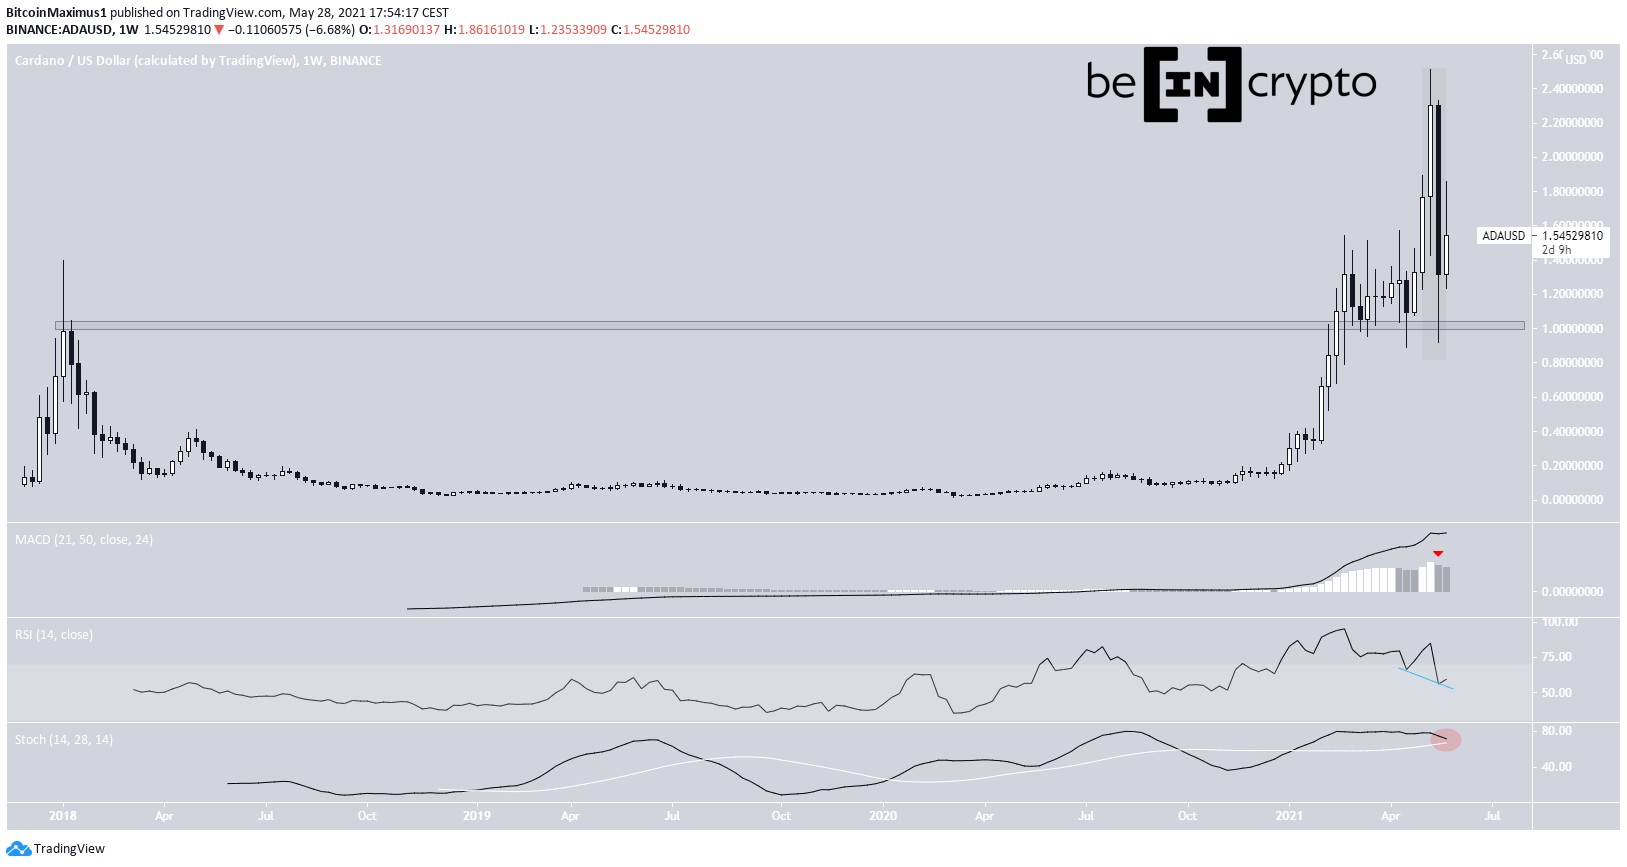
Cardano (ADA) has been moving downwards since reaching an all-time high price of $2.51 on May 16.
It decreased sharply between May 16 and May 19, validating the previous all-time high resistance as support. However, technical indicators fail to confirm the direction of the trend.
Long-term ADA movementADA reached an all-time high price of $2.51 on May 16. However, it decreased sharply afterwards, decreasing by 65% in the next three days. This led to a low of $0.91 on May 19. Furthermore, ADA created a bearish engulfing candlestick in the weekly time-frame.
Despite the drop, the token has validated the previous all-time high resistance area of $1 as support.
Technical indicators are mixed. The MACD has created a lower momentum bar but has not given a bearish reversal signal. The RSI is decreasing but has generated hidden bullish divergence. The Stochastic oscillator is decreasing but has not made a bearish cross yet.
Therefore, a look at a lower time-frame is required in order to determine the direction of the trend.
Chart by TradingviewCryptocurrency trader @CryptoCapo outlined an ADA chart stating that the movement looks extremely bullish. This is because the price has re-tested the previous all-time high resistance area, potentially validating it as support.
Source: Twitter Ongoing BounceThe daily chart is not very helpful in determining the current trend.
On one hand, ADA has bounced at an ascending support line in place since Feb. 3. On the other, technical indicators are bearish. This is especially evident by the bearish cross of the Stochastic oscillator.
Therefore, it seems likely that another re-test of the support line will transpire. The line nearly coincides with the previously outlined long-term support area at $1.
For that reason, despite a lack of conviction from technical indicators, we can consider the trend bullish as long as the price is trading above this level.
Chart by Tradingview ADA/BTCThe ADA/BTC chart looks more decisively bullish than its USD counterpart. Despite last week’s decrease, the token is still trading above the 3,800 satoshi area, validating it as support.
Technical indicators are leaning on bullish. Prior to the drop, there was a bearish divergence present in the RSI. As a result of the drop, it has already played out.
Both the MACD & Stochastic oscillator are still positive. The next resistance area is found at 6,150 satoshis.
Chart by TradingviewFor BeInCrypto’s latest bitcoin (BTC) analysis, click here.
The post ADA Bounces After Retesting Previous All-Time High appeared first on BeInCrypto.
origin »Bitcoin price in Telegram @btc_price_every_hour
Cardano (ADA) на Currencies.ru
|
|