Polkadot (DOT) Bounces and Attempts to Initiate a Bullish Reversal

Polkadot (DOT) Bounces and Attempts to Initiate a Bullish Reversal
фото показано с : beincrypto.com

2021-5-24 16:30

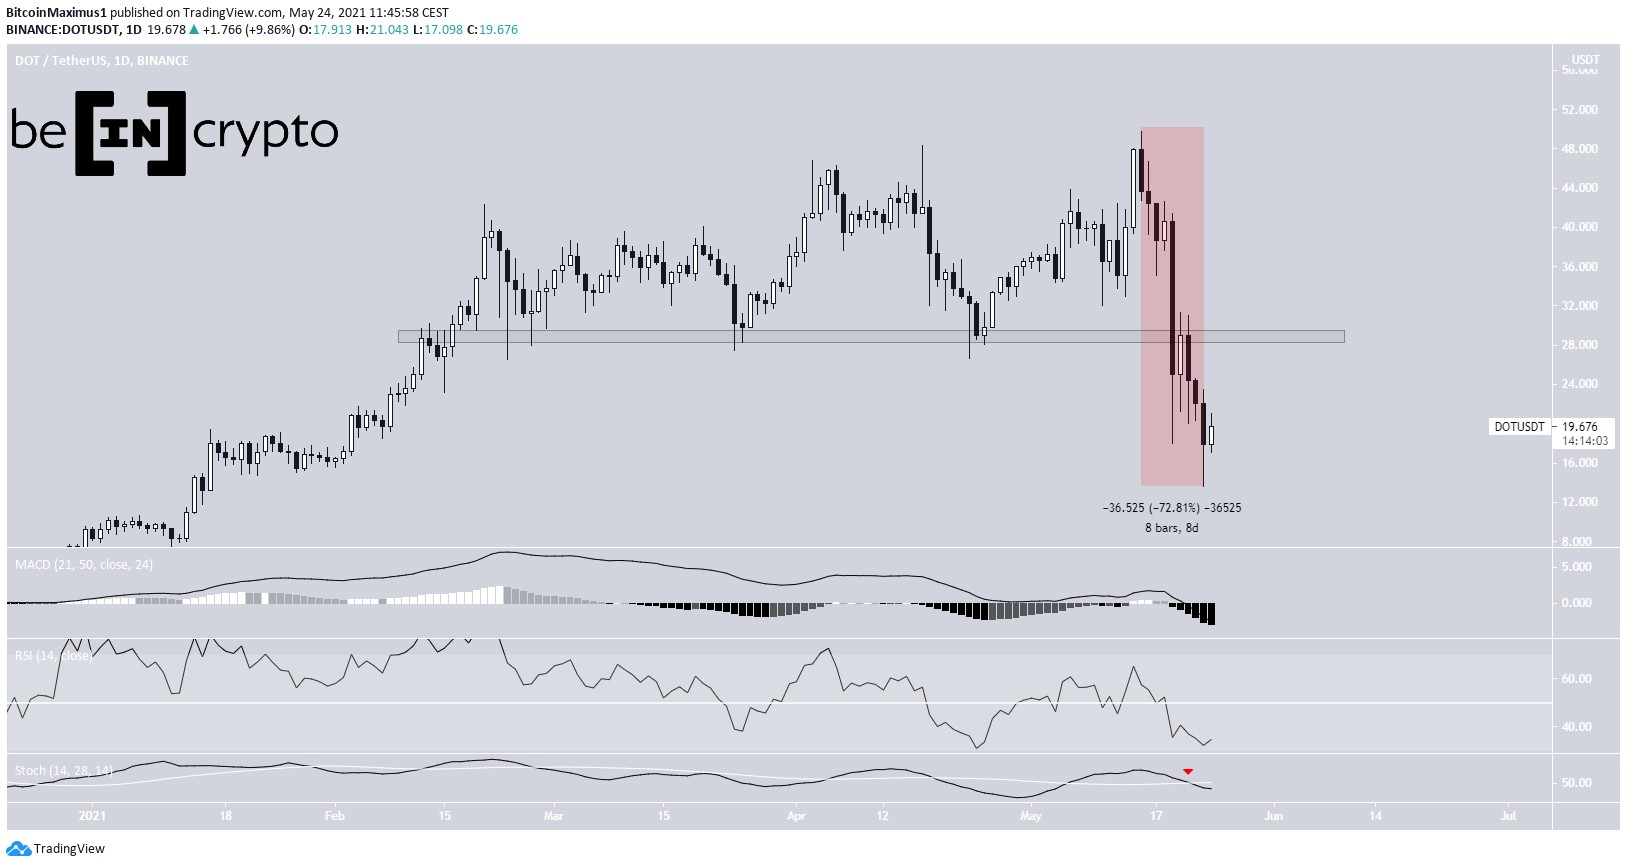
Polkadot (DOT) has been moving downwards since May 15, when it reached an all-time high of $49.78.

While it has temporarily halted the decrease with a significant bounce, the bullish reversal is not confirmed yet.

Polkadot drops after all-time high

Polkadot has been decreasing since May 15. The drop has been sharp and swift — in a period of only eight days, DOT has fallen by nearly 73%. 

While there has been a slight resurgence since May 23, it has been weak. 

Technical indicators are bearish. The Stochastic oscillator has made a bearish cross, the MACD is negative, and the RSI is below 50. 

The main resistance area is found at $29. The level had previously been acting as support since Feb. 8. Until it’s reclaimed, we cannot consider the trend bullish.

Last week, the DOT team announced the integration of PARSIQ smart triggers. It remains to be seen if this announcement will have any positive long-term effect on the price of the token.

DOT Chart By TradingView Short-term movement

The two-hour chart is more bullish. It shows a descending wedge, from which DOT has potentially broken out. 

The breakout was preceded by a strong bullish divergence in both the RSI and MACD. 

It’s possible that this is the beginning of the upward movement that will cause DOT to reclaim the $29 level. However, this is not yet confirmed. 

Until the $29 area is reclaimed, we cannot confidently suggest that the trend is bullish.

DOT Chart By TradingView DOT wave count

Cryptocurrency trader @Thetradinghubb outlined a DOT chart, stating that the correction is complete and the token is likely going to reach new highs.

Source: Twitter

This could occur according to the wave count. It’s possible that Polkadot has just completed wave four (white) of a five-wave bullish impulse. 

However, this scenario is not yet confirmed. While DOT has bounced at the 0.786 Fib retracement level, it has not given any clear bullish reversal signs, as seen by technical indicators in the daily time frame. 

Reclaiming the $29 area is crucial for this scenario to transpire.

In addition, the invalidation level is considerably below the current price, falling at the wave one high of $6.80.

For BeInCrypto’s latest bitcoin (BTC) analysis, click here.

The post Polkadot (DOT) Bounces and Attempts to Initiate a Bullish Reversal appeared first on BeInCrypto.

Similar to Notcoin - Blum - Airdrops In 2024

origin »

Polkadot [IOU] (DOT) на Currencies.ru

$ 0 (+0.00%)
Объем 24H $0
Изменеия 24h: 0.28 %, 7d: -19.29 %
Cегодня L: $0 - H: $0
Капитализация $0 Rank 99999
Цена в час новости $ 296.73 (-100%)

bullish reversal dot polkadot halted temporarily significant

bullish reversal → Результатов: 126


Фото:

Has the New Bitcoin Bull Market Officially Begun?

Bitcoin’s status as an uncorrelated asset makes it extremely difficult to gauge the timing of the market cycle. Its volatility makes it easy for traders to get pump-faked and get liquidated when the market takes an unexpected reversal, so, are we finally in a bull market? Are We in a Bitcoin Bull Market? Benjamin Cowen, a trader who goes by intothecryptoverse on Twitter, has released a video where he addresses Bitcoin’s recent bullish price actionRead More

2020-2-16 19:00


These 3 Reasons Are Why Bitcoin’s Price May Soon Explode Past $10,000

Over the past month, Bitcoin (BTC) has absolutely exploded higher. In fact, the cryptocurrency is up around 40% since the low of $6,400 put in during December of last year. While many analysts have said that this jaw-dropping rally constitutes a macro reversal that will thrust BTC back into a decisively bullish phase, some aren’t... The post appeared first on NewsBTC.

2020-1-22 13:00


This Analysis Suggests Bitcoin’s Price May Plunge 50% to the $3,000s, Again

Over the past month, Bitcoin (BTC) has absolutely exploded higher. In fact, the cryptocurrency is up around 40% since the low of $6,400 put in during December of last year. While many analysts have said that this jaw-dropping rally constitutes a macro reversal that will thrust BTC back into a decisively bullish phase, an analysis... The post appeared first on NewsBTC.

2020-1-20 03:45


Bitcoin Poised to Collapse Under $5,000? Market Cycle Fractal Suggests So

Over the past few weeks, Bitcoin (BTC) has found itself consolidating in the low-$7,000s, holding this key support region as bears threaten the cryptocurrency’s demise. While this consolidation has been bullish, in that selling pressure has abated for weeks, setting the stage for a bullish reversal, a market cycle analysis by a popular crypto trader.

2019-12-15 23:49


Santander Exec Praises Blockchain Tech After $20M Ethereum-Issued Bond Redemption

Santander, the Spanish banking group, recently became the subject of a Whale Alert tweet as they redeemed their first blockchain bond on the Ethereum ledger, worth $99,000. With this announcement, there are many cryptocurrency proponents that seem optimistic about the direction of Ethereum’s price, pushing for a bullish reversal. While that reversal has yet to […]

2019-12-11 23:33


Tezos Price Analysis: Continuous Growth

Tezos has a bullish short-term and medium-term trading outlook The four-hour time frame shows that a bearish reversal may start to take place The daily time frame continues to show the presence of a large bullish pattern   Tezos is starting to correct lower after the cryptocurrency recently rallied to its highest trading level since […] The post Tezos Price Analysis: Continuous Growth appeared first on Crypto Briefing.

2019-12-11 19:17


Standard Tokenization Protocol Price Analysis: Positive Changes

STPT/USD has a bullish short-term and medium-term trading outlook The four-hour time frame shows that a bullish reversal pattern has formed The daily time frame shows that a bullish double-bottom pattern has formed   Standard Tokenization Protocol is starting to show positive technical signs on both the lower and higher time frames, with the cryptocurrency […] The post Standard Tokenization Protocol Price Analysis: Positive Changes appeared first on Crypto Briefing.

2019-12-9 17:05


Decred Price Analysis DCR / USD: Bullish Reversal

Decred has a bullish short-term and a bearish medium-term trading outlook The four-hour time frame shows that large inverted head and shoulders pattern has formed The daily time frame shows a large descending triangle pattern Decred has been on the rise since Chinese President Xi Jinping’s positive comments towards blockchain and cryptocurrencies, with the DCR […] The post Decred Price Analysis DCR / USD: Bullish Reversal appeared first on Crypto Briefing.

2019-11-11 18:52