Chart - Свежие новости [ Фото в новостях ] | |

After 13% Surge, Ethereum Has the “Most Bullish Chart Right Now”: Analyst
It’s been an explosive past 24 hours for the Ethereum market. As covered by NewsBTC, on Wednesday the asset gained approximately 8% in five minutes, surging past the pivotal $250 resistance. ETH now trades at $275 as of this article’s writing, having inched higher after the aforementioned surge. дальше »
2020-7-24 03:00 | |
|
|

Will ADA Break Out Above 1500 Satoshis?
The Cardano (ADA) price has been increasing since March and doing so at an accelerated rate since June. The price is currently correcting, after which the upward move should resume. Long-Term ADA Movement The weekly chart for ADA shows a double bottom combined with significant bullish divergence on the weekly RSI from August 2019 – […] The post Will ADA Break Out Above 1500 Satoshis? appeared first on BeInCrypto. дальше »
2020-7-21 20:29 | |
|
|

Altseason on the Horizon as Bitcoin Remains Range-Bound
The altcoin market appears to be on the cusp of another altseason rally as tokens experience massive price surges while Bitcoin remains locked in sideways accumulation. Altcoin Tokens Surge as DeFi Market Explodes Tweeting on Monday (July 20, 2020), crypto analyst @Crypto_Ed_NL published a chart showing that a new altseason could be on the horizon. дальше »
2020-7-21 19:07 | |
|
|

Bitcoin Can “Move Faster” Than Tesla If It Breaks This Key Level: Trader
Unlike Bitcoin, the stock of Tesla (TSLA) has been on a tear over recent weeks and months. Just look at the chart below, which shows that the shares of the world-famous car company have gone parabolic. дальше »
2020-7-20 23:30 | |
|
|
Analyst: Bitcoin Looks Exactly As It did Prior to 2017’s 2,000% Rally
Multiple analyses have shown that Bitcoin looks primed to see a macro rally despite the ongoing uncertainty and lack of volatility. Related Reading: BTC Just Confirmed a Signal That Preceded Historical 5,000% Rallies Bitcoin Looks Extremely Similar to the Start of Previous Macro Rallies According to a cryptocurrency trader, the simple chart below explains why he […] дальше »
2020-7-19 13:00 | |
|
|

XRP Could Accelerate Lower as Chart Resembles Bitcoin’s October High
Last week, XRP saw its first large bout of bullish price action in over a month. Following the lead of a swath of other altcoins, the prominent cryptocurrency spiked by approximately 10% in a single day, passing the crucial resistance of $0. дальше »
2020-7-16 15:00 | |
|
|
100-day SMA Could Ignite a Bullish Breakout for Bitcoin: Here’s Why
Bitcoin is trading in a contracting range above $9,000 against the US Dollar. BTC’s daily chart suggests that the price could rally above $9,300 as long as it is above the 100-day SMA. Bitcoin is holding a couple of important supports near $9,000 and $8,800. дальше »
2020-7-16 06:58 | |
|
|

Chainlink Sees “Off the Chart” Exchange Inflows as Whales Look for an Exit
Chainlink’s impressive multi-year high reached a boiling point a couple of days ago when bulls pushed it to fresh highs of $8. 50 The crypto faced a firm rejection here that has since caused its price to reel lower Buyers have since been able to construct what could be a mid-term bottom within the lower-$7. дальше »
2020-7-15 23:00 | |
|
|
Binance Coin Price Analysis - Third Year Anniversary
Technicals for BNB to USD suggest a nascent bullish trend as the BNB price is now above the 200-day EMA and daily Cloud. A potential bullish chart pattern is also close to resolving, which may propel price to US$38. дальше »
2020-7-15 12:04 | |
|
|

Analyst: There’s a 90% chance that Bitcoin price will soar past $10,000 come August
For the past three weeks, nearly every indicator on the technical chart is signaling a price breakout for Bitcoin. All of these signals are showing that Bitcoin is in the best position to break out and trade above $10,000. дальше »
2020-7-15 10:47 | |
|
|

Chainlink (LINK) Smashes Through Its All-Time High Price
On July 6, the Chainlink (LINK) price broke out from the $4. 9 resistance area that had been in place since July 2019. Since then, the price has increased by almost 70%. All-Time High A look at the weekly chart shows that LINK has been on an upward trend since its inception. дальше »
2020-7-14 01:30 | |
|
|

Bitcoin’s Rallied 4,000% After This Signal Flashed in 2016. It’s Back Again
By definition, Bitcoin is still in a bear market. One analyst recently commented in reference to the chart below. “Allow me to explain: BTC hasn’t made a higher high in a full year, so per definition, it’s not a bull market. дальше »
2020-7-12 10:00 | |
|
|

DeFi Markets Tap New High, Elrond Surges, and MakerDAO Improves Governance
It’s been another wild week for decentralized finance markets with Kyber and Aave joining the liquidity race. Markets are also hitting new highs. Industry stalwart MakerDAO has also made some improvements to its governance model, while Elrond is simply off the chart. дальше »
2020-7-11 20:30 | |
|
|

Gold Is Booming — and That Means Bitcoin Could Soon Break $10,000
While markets like Bitcoin and the S&P 500 have flatlined over recent weeks, gold has rocketed higher. As can be seen in the chart below, the precious metal has exhibited strength since a dip to $1,670 in June. дальше »
2020-7-11 13:00 | |
|
|
Altcoin Season On The Horizon Following Ethereum’s Bullish Breakout, Says Veteran Trader
Legendary trader Peter Brandt affirms that the altseason is nearby upon a significant breakout in Ethereum. Brandt’s chart sees ETH/BTC first breaking the resistance at 0. 02561, which the trading pair struggled to crack since June 1. дальше »
2020-7-11 11:46 | |
|
|

Bitcoin Daily Chart Indicates Crucial Bullish Breakout Towards $10,000
Bitcoin is rising steadily and it recently broke the $9,400 resistance against the US Dollar. BTC’s daily chart suggests that the bulls are likely aiming a larger rally towards $10,000. Bitcoin formed a strong support base near $9,000 and recently started a fresh increase. дальше »
2020-7-9 06:58 | |
|
|

Despite Rally to $250, Ethereum Was Just Dealt This Fundamental Blow
Like most of the cryptocurrency market, Ethereum has performed well over the past few days. This strength culminated in a rally to the crucial level of $250 on Wednesday, as depicted in the chart seen below. дальше »
2020-7-9 04:00 | |
|
|
After 150% TikTok Pump, Jake Paul Says Dogecoin (DOGE) Is “Gonna Go Crazy”
Forget Bitcoin and Ethereum, Dogecoin (DOGE) has been on an absolute tear over the past few days. Just look at the chart below, which shows that the meme cryptocurrency is up more than 150% in the past three days. дальше »
2020-7-9 00:14 | |
|
|
VeChain (VET) Rallies 100% in a Week: Has the Surge Topped Out?
It isn’t only Cardano, Chainlink, and DeFi coins that are rallying at the moment. VeChain (VET), one of the hottest crypto properties of the last bubble, is up 20% in the past hour alone. Stepping back slightly, the asset’s performance is even more impressive. дальше »
2020-7-9 21:30 | |
|
|
Cardano Has More Room to Go Up Based On These On-Chain Metrics
One of the so-called “Ethereum killers,” Cardano has made it to the headlines of the cryptocurrency market after the 80% bull run it has seen over the past week. The increasing buying pressure behind it seems to be fueled by the progress the IOHK team has made to finally roll-out the Shelley upgrade. Chart of […] дальше »
2020-7-9 21:00 | |
|
|

Binance CEO: 95% of Crypto Projects Are Unlikely to “Pump” This Cycle
Crypto altcoins have ignored Bitcoin’s inability to rally over recent weeks. Take the chart below, which shows that BTC has strongly underperformed some of the leading cryptocurrencies since the start of June. дальше »
2020-7-9 13:00 | |
|
|

Bitcoin’s Pattern Breakout Fails to Clear Overhead Resistance
The Bitcoin (BTC) price has been decreasing since it reached a high of $9,379 on July 7. Today, it broke out from a descending wedge, but could not sustain the higher prices. Bitcoin Short-Term Breakout The hourly chart for BC reveals that the price has been decreasing since a high of $9,379 reached on July […] The post Bitcoin’s Pattern Breakout Fails to Clear Overhead Resistance appeared first on BeInCrypto. дальше »
2020-7-8 11:55 | |
|
|

XRP’s Recent Collapse Could Force Ethereum Under $200, Analyst Suggests
While Bitcoin, Ethereum, and other top cryptocurrencies are near year-to-date highs, the same cannot be said for XRP. As the chart below depicts, the leading altcoin is trading at $0. 185 as of this article’s writing. дальше »
2020-7-8 04:00 | |
|
|

Inverse Bitcoin Fractal from 2019 Warns of Major Bearish Moves Ahead
The bitcoin chart shows an interesting inverse fractal from 2019. The Feb-March price action last year, which resulted in a breakout, hints a breakdown for Bitcoin in 2020. Bitcoin is currently moving in the same manner as it did back in 2019 – just inversely. дальше »
2020-7-8 11:13 | |
|
|

An Accurate Bitcoin Analyst Expects a “Large” Correction in Altcoins
This may sound like a broken record but it’s been a strong year thus far for altcoins compared to Bitcoin. Just look at the chart below, which shows that since the start of the year, BTC has underperformed many altcoins. дальше »
2020-7-6 01:00 | |
|
|

Bitcoin’s Chart Is Looking More and More Like February’s $10,500 Top
There’s no doubt that Bitcoin’s price action has been weird over recent weeks. As the S&P 500 has entered a range, so too has the cryptocurrency. In the past week, BTC has literally traded in a 5% range. дальше »
2020-7-5 01:00 | |
|
|

Last Time Bitcoin Volatility Was This Low, BTC Surged by 25% in 24 Hours
For the past few weeks, Bitcoin analysts have observed extremely low volatility in the nascent cryptocurrency market. Nothing shows this inaction quite as well as the chart below from Blockroots founder Josh Rager. дальше »
2020-7-4 07:00 | |
|
|

This Unexpected Factor Suggests Bitcoin May Crash From $9,000s, Not Rally
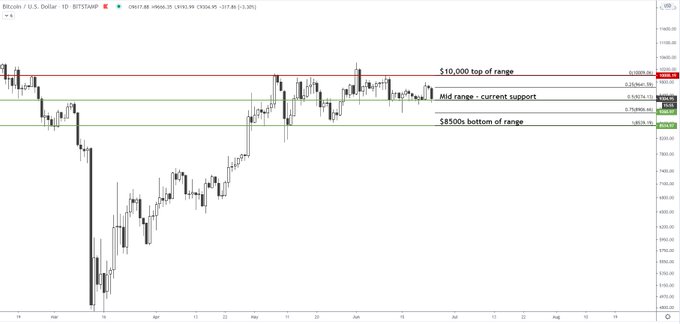
Bitcoin is in no man’s land. Just look at the chart below from analyst Josh Rager, which shows that BTC hasn’t even moved out of the $8,500-10,000 range for eight weeks: “BTC’s range is clear. дальше »
2020-7-4 04:00 | |
|
|
If the S&P 500 Passes 3,200, Then Bitcoin Can Retake $9,500: Analyst
If you’ve followed Bitcoin analysts over recent weeks, you likely know of the importance of $9,500 to the cryptocurrency. As the chart below indicates, $9,500 has been a crucial price point for Bitcoin over the past two months. дальше »
2020-7-3 04:00 | |
|
|

Analyst Expects Bitcoin Price to Hit $27,000; Here’s Why
Bitcoin may hit $27,000 in the coming sessions, says an analyst. The analogy appeared as the cryptocurrency trends inside a Bullish Pennant structure on its monthly chart. The analyst sees BTC/USD breaking above the technical pattern and aim for an all-time high as its upside target. дальше »
2020-7-2 12:02 | |
|
|

Ethereum Bulls Defend Crucial Support, But Outlook Remains Gloomy
Despite navigating down towards its crucial support at $220, Ethereum’s buyers were able to defend against a break below this level The cryptocurrency now appears to be well-positioned to maintain above this level in the near-term, as buyers are currently ardently defending another crucial support level That being said, on its daily chart the cryptocurrency does appear to be flashing some signs of overt weakness One group of analysts recently noted that the recent break […] дальше »
2020-7-2 23:00 | |
|
|

Is NEO Bullish or Bearish? A Deeper Look
Both the NEO/BTC and NEO/USD pairs have been declining since they reached their respective long-term descending resistance lines at the beginning of June. The short-term chart looks slightly more bullish for NEO/BTC than it does for NEO/USD. дальше »
2020-7-1 16:00 | |
|
|

This Altcoin Could Increase By 60% in July
The TROY (TROY) price has created a bullish reversal pattern inside a support area, indicating that it is likely to move upwards towards the current range high. Cryptocurrency trader @TheEuroSniper outlined a TROY chart, in which a short-term range between 30-47 satoshis is outlined. дальше »
2020-7-1 08:45 | |
|
|
A “Huge” Bitcoin Move Is Imminent as Price Stalls in the Low-$9,000s
While Bitcoin has seen its fair share of short-term volatility, on a macro scale the cryptocurrency is still consolidating. The below chart from Blockroots founder Josh Rager, a crypto trader, displays this well. дальше »
2020-6-30 03:00 | |
|
|

Bitcoin Flips Bearish as Dreaded “Death Cross” Returns
Bitcoin’s price is flashing some signs of weakness again as it nears it crucial $9,000 support The multiple tests of this level do seem to indicate that it is growing weaker, and it may only be a matter of time before sellers forcefully push BTC beneath it This comes as the be3nchmark cryptocurrency grows bearish from a technical perspective Analysts are noting that it recently formed a widely dreaded “death cross’ on its four-hour chart, […] дальше »
2020-6-30 21:00 | |
|
|
A Chilling Bitcoin “Death Cross” Reappears With a Gloomy Stocks Correction
Bitcoin has formed a “Death Cross” pattern on its daily chart as price slips ahead of the New York opening bell. The cryptocurrency’s 50-day simple moving average today closed above its 20-day exponential moving average. дальше »
2020-6-25 16:00 | |
|
|
Bitcoin “Death Cross” Pattern that Last Crashed Price By 55% Appears Again
Bitcoin has come closer to forming a dreaded Wall Street chart pattern: the Death Cross. The bearish technical indicator materializes when an asset’s long-term moving average crosses above its short-term moving average. дальше »
2020-6-23 14:00 | |
|
|


Two Altcoins that May Have Finished Correcting
Both ICON (ICX) and Dusk Network (DUSK) have been retracing after completing upward moves. The short-term patterns suggest a further reversal and continuation of the previous upward movements. ICON (ICX) The daily ICX chart shows that the price has been decreasing since reaching a high of 4,046 satoshis on May 26. дальше »
2020-6-23 15:15 | |
|
|

Bitcoin Dominance Bear Flag Nears Breakdown, But 58% Level Remains Barrier To Altcoin Season
A bearish chart formation has appeared on Bitcoin dominance that could lead to another leg down and rebound in altcoin/BTC pairs. However, the 58% level could remain a barrier, keeping a full-blown altcoin season from occurring for quite some time longer. дальше »
2020-6-20 23:00 | |
|
|

Analyst: Ethereum Price’s Chart Looks “Ominous” After $250 Rejection
Like Bitcoin and most other top cryptocurrencies, the past few weeks have been stagnant for Ethereum. The cryptocurrency has consolidated around ~$230, failing to breakout in either direction. Stepping back, though, analysts are saying that ETH’s chart looks bearish. дальше »
2020-6-18 04:00 | |
|
|

IOTA Signals A Long-Term Trend Reversal
The IOTA price has been consolidating near 2000 satoshis since August 2019. The price has been showing strong signs of a reversal, indicating that a bullish trend may soon begin. Weekly Analysis The weekly chart for IOTA reveals that the price has been decreasing since September 2018. дальше »
2020-6-18 23:15 | |
|
|
Bitcoin Daily Chart Points A Crucial Breakout Setup With Resistance At $10,000
Bitcoin is trading well above key supports on the daily chart against the US Dollar. BTC seems to be preparing for a crucial bullish breakout above the $10,000 resistance zone. Bitcoin traded as high as $10,390 before it started a minor downside correction. дальше »
2020-6-17 06:58 | |
|
|