Chart - Свежие новости [ Фото в новостях ] | |

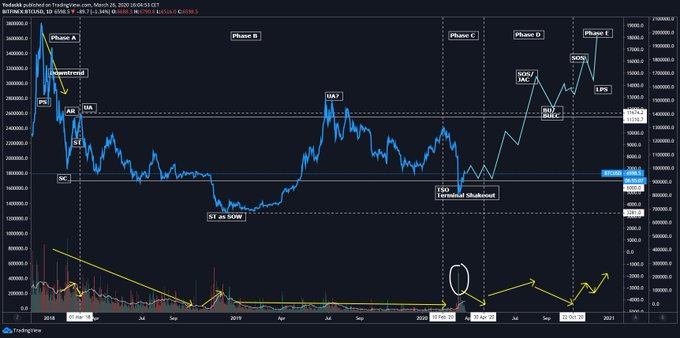
Chart Pattern That Predicted Bitcoin’s Ongoing Rally: More Upside to Come
In March, few expected Bitcoin to be in the place that it currently is in. The coin is up over 200% since the lows of March, showing that the crypto market is far from dead. Back at the lows, there were some that feared that cryptocurrencies wouldn’t be around for much longer. дальше »
2020-9-29 15:00 | |
|
|

Neo (NEO) price may gain over 70% on this chart pattern
Neo (NEO) price is enjoying a great month as it gained to log 2-year highs at $25. 90. After breaking the $21. 00 handle, the buyers activated a double bottom chart pattern which may push the price action to $36. дальше »
2020-9-27 19:32 | |
|
|
A Lifelong US Dollar Downtrend Paints Bullish Outlook for Bitcoin
The US dollar is on track for its most significant monthly performance since July 2019. But it continues to feel the pressure from its all-time bearish outlook. Why? A monthly chart of the US dollar index (DXY), a barometer to gauge its performance against a basket of top foreign currencies, shows the greenback in a lifelong downtrend. дальше »
2020-9-25 08:44 | |
|
|


Bitcoin is Eerily Copying Gold Trends; Analyst Fears Breakdown
Bitcoin is laggingly tailing the gold chart trends, and it may face trouble for its delayed correlation. That is due to the precious metal’s latest breakdown move, wherein the price broke out of a Symmetrical Triangle pattern to the downside. дальше »
2020-9-23 11:08 | |
|
|
Here’s Why Bitcoin’s Macro Chart Remains Bullish Despite $12k Rejection
Earlier this month, Bitcoin was rejected at the pivotal $12,000 resistance level after recovering from a drop to $11,000. The cryptocurrency proceeded to drop as low as $9,800, with the market selling the failed breakout attempt. дальше »
2020-9-20 10:00 | |
|
|
Ethereum Risks Plunging Towards $350 Following Rejected Spikes
A string of back-to-back upside rejections at a local top is putting Ethereum at risk of correcting lower towards $350. Looking at ETH/USD 1H chart shows the pair attempting to close above $384, a resistance target that had held through extreme bullish biases in the past. дальше »
2020-9-17 16:00 | |
|
|
DOGE Continues Its Prolonged Consolidation
The Dogecoin (DOGE) price has been consolidating after a rapid pump and dump on July 10. Currently, there are no signs that suggest the price is likely to begin an upward or downward move. However, the DOGE/USD chart looks considerably more bullish than the DOGE/BTC one. дальше »
2020-9-17 17:30 | |
|
|
This Chart Pattern Suggests Bitcoin Is on the Verge of a Macro Bull Trend
Bitcoin has undergone a strong drop since posting a number of highs near $12,000 in August. The coin now trades at $10,700 as of this article’s writing, nearly $2,000 before the year-to-date high. дальше »
2020-9-15 13:00 | |
|
|
Why One On-Chain Analyst is Wary About Bitcoin’s “CME Gap” Narrative
One widespread narrative that cryptocurrency investors have been closely watching as of late is regarding Bitcoin’s propensity to fill gaps that are formed on its CME futures chart. Although this trend has proven to hold true in some cases with both Bitcoin and other assets, it is important to note that the narrative is laced […] дальше »
2020-9-12 05:00 | |
|
|

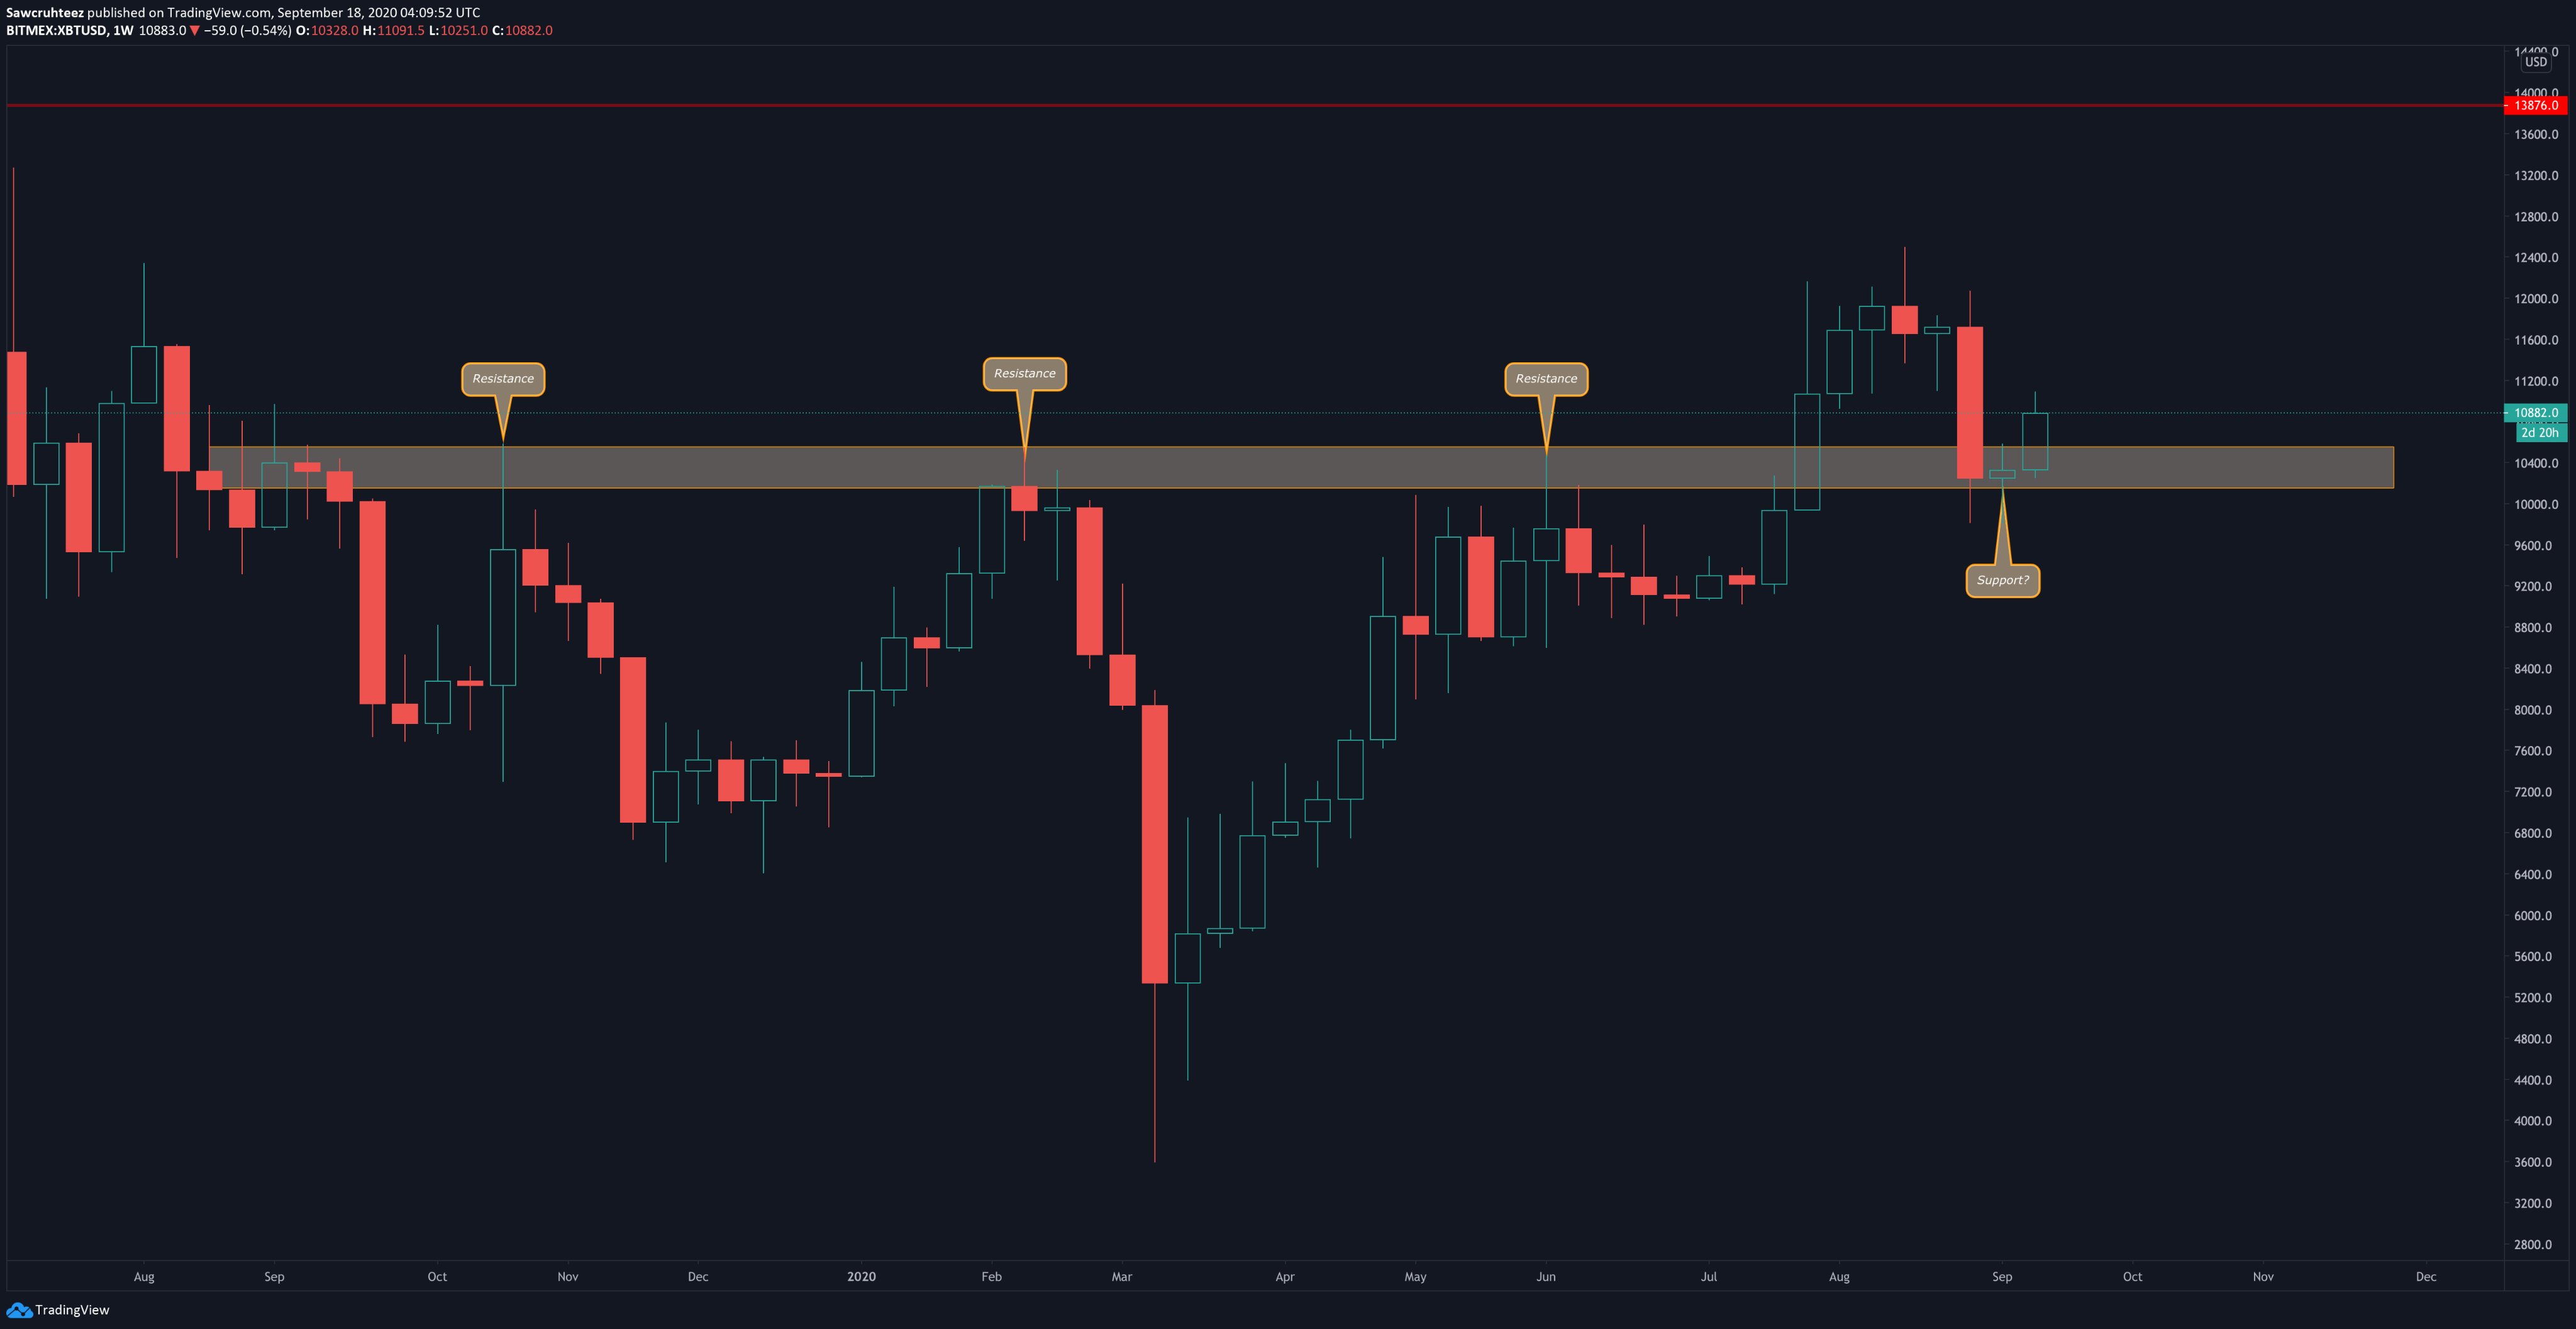
A Bearish Reversal in Stock Market May Bleed Bitcoin: Analyst
Bitcoin remains at the risk of losing a part of its yearly gains on a negative stock market sentiment, according to Kevin Svenson. The chart analyst highlighted the S&P 500’s three-day rout this week, adding that if it becomes a “confirmed reversal,” then it would take Bitcoin–and the rest of the cryptocurrency market–lower in tandem. дальше »
2020-9-11 09:54 | |
|
|
Top Bitcoin analyst flips bullish after predicting the 20% retracement last week
Since peaking at local highs of $12,075 last week, Bitcoin has experienced a strong drawdown as depicted in the chart below. The post Top Bitcoin analyst flips bullish after predicting the 20% retracement last week appeared first on CryptoSlate. дальше »
2020-9-8 17:00 | |
|
|

Is Bitcoin (BTC) a buy or sell in September?
Bitcoin (BTC) price is currently trading over 2% in the red on a weekly chart as technicals point to a continuation in the downtrend in the coming days and weeks. Fundamental analysis: Can Bitcoin stage a rally? Bitcoin price recorded some sharp price swings over the last week, keeping investors alert. дальше »
2020-9-9 13:33 | |
|
|
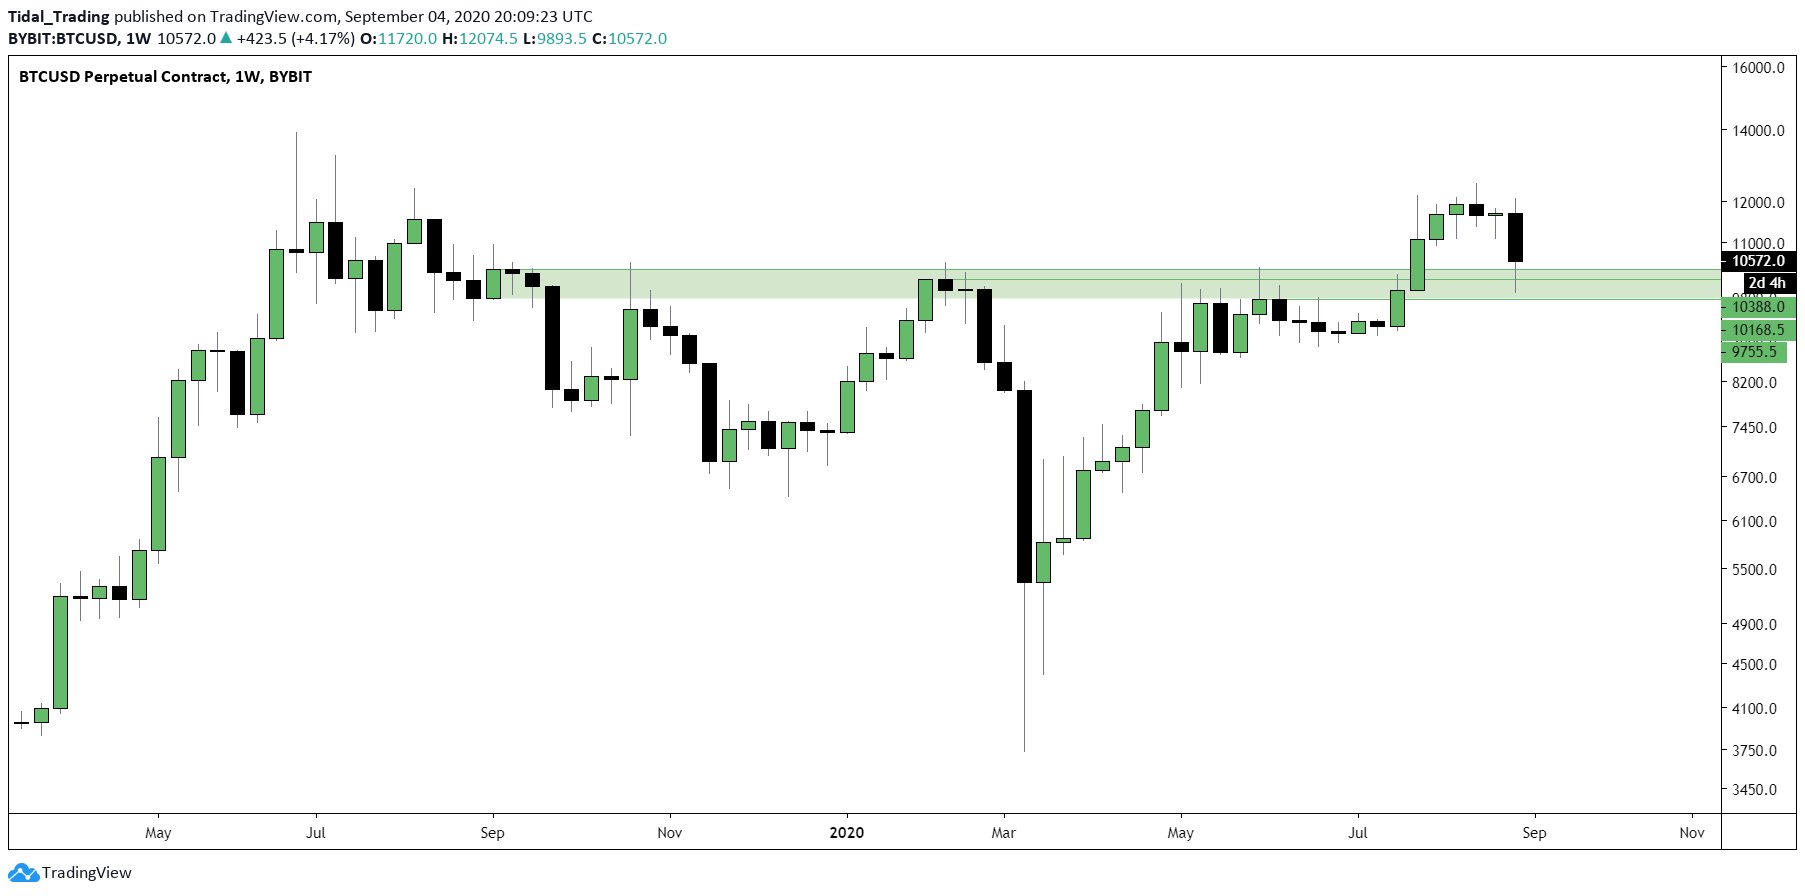
Bitcoin in “Golden Accumulation Zone” After 20% Plunge: Analyst
It may be the best time for Bitcoin traders to refill their crypto bags now that the asset trades near its multi-week lows, according to analysts at Phi-Deltalytics. The chart analysis portal stated that Bitcoin is in a “golden accumulation zone,” citing a string of fundamental and technical catalysts that could propel the cryptocurrency’s price higher. дальше »
2020-9-8 11:00 | |
|
|
Количество «Ethereum-китов» выросло с начала сентября
Падение стоимости крупнейшего альткоина эфира (ETH) примерно на 30% привело к тому, что выросло количество крупных держателей этой криптовалюты. ‘@santimentfeed‘s holder distribution chart shows that as #Ethereum was falling, there was a spike in the number of addresses with millions of dollars in #ETH, colloquially known as whales. Roughly 68 new whales holding 1K to […] дальше »
2020-9-8 16:51 | |
|
|

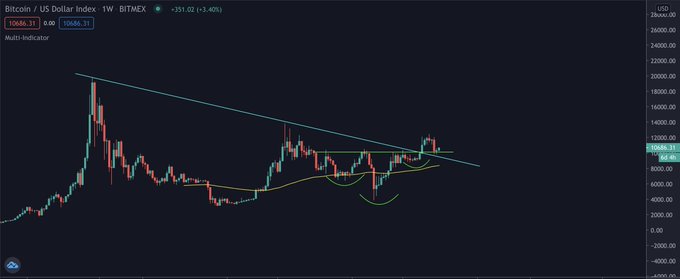
This Simple Chart Shows Why Bitcoin Remains Bullish on a Macro Scale
Bitcoin has sustained a strong drop over the past few days as legacy markets have undergone a strong correction after a record rally. The leading cryptocurrency traded around $9,800 on Friday morning as bears sent the cryptocurrency lower. дальше »
2020-9-5 07:40 | |
|
|
After Validating Support, ZEC Looks Primed for Continuation
The Zcash (ZEC) price has broken out from an important resistance area and validated it as support afterward. The price should continue moving upwards and create a new yearly high. Long-Term Movement The weekly chart shows that ZEC has broken out above the $77. дальше »
2020-9-2 22:18 | |
|
|
Ethereum Aims to Increase Towards $600
The Ethereum (ETH) price has broken out from a long-term resistance level and validated it as support. As long as it’s trading above here, the trend remains bullish. Breakout From Long-Term Range Cryptocurrency trader @CryptoMichNL outlined an Ethereum chart, stating that if the current level holds, ETH could rally all the way to $500. дальше »
2020-9-1 21:38 | |
|
|
The Winklevoss Twins think Bitcoin will hit $500,000 over a long period of time
By most analysts’ interpretations of the Bitcoin price chart, the cryptocurrency market is in the early innings of another bull trend. The post The Winklevoss Twins think Bitcoin will hit $500,000 over a long period of time appeared first on CryptoSlate. дальше »
2020-8-31 02:00 | |
|
|
Triple Repeat Fractal on Bitcoin Chart Hints Dip towards $10K
A triple repeat fractal warning on Bitcoin (Symbol: BTCUSD) hourly chart is pointing to a major price dip towards $10,000. First spotted by an analyst at 100eyes, an automated crypto trading scanner, the fractal shows Bitcoin in a deja-vu downtrend. дальше »
2020-8-28 11:45 | |
|
|
Cardano short-term price analysis: 26 August
Cardano's surge, like most altcoins, seems to have come to standstill. The price of ADA has dropped approximately 23% in the last week and 6.7% in the last 24 hours. Cardano 1-hour chart ADAUSD TraThe post Cardano short-term price analysis: 26 August appeared first on AMBCrypto. дальше »
2020-8-27 21:00 | |
|
|
Bitcoin Cash short-term price analysis: 26 August
The 24-hour chart marked one of the strongest correction periods for the collective cryptocurrency space in August. Bitcoin re-tested its support range from $11,400-$11,200 at press time. Taking the kThe post Bitcoin Cash short-term price analysis: 26 August appeared first on AMBCrypto. дальше »
2020-8-27 20:00 | |
|
|

August 22 – Ripple (XRP) price could fall to $0.21 on this chart pattern
Ripple (XRP) price has fallen nearly 8% this week as the sellers take control of the price action. The sellers have been working on a specific bearish chart pattern that could eventually take the price action to low $0. дальше »
2020-8-23 21:29 | |
|
|

Analyst Explains Anatomy Of An Altcoin Shakeout With BAT’s Vertical Rally
Technical analysis is an important aspect of investing and even more important to trading. It isn’t an exact science, but it can help to increase probabilities by watching for chart patterns on altcoins like Ethereum, Cardano, BAT, Binance Coin, and others. дальше »
2020-8-22 23:00 | |
|
|

Analyst on Bitcoin: Wall Street Isn’t Ready For What’s Next
Bitcoin price just set a new yearly high after pushing above $12,000 and may be gearing up for an explosive move higher. The first-ever cryptocurrency may be finally entering a new uptrend. If this is the case, and the asset continues to follow the stock-to-flow model, Wall Street may be left in shock after having to adjust their chart settings to keep up with Bitcoin’s logarithmic growth. дальше »
2020-8-19 18:16 | |
|
|
Blast From the Past: Bitcoin Following Black Thursday “Supercycle”
Bitcoin price has just today set a new high for 2020 and is showing no signs of slowing down. However, as greed reaches extreme levels and ROI is stacking across the board, could the cryptocurrency see a surprise correction? According to a chart that first debuted around Black Thursday, this latest high will result in […] дальше »
2020-8-18 04:00 | |
|
|
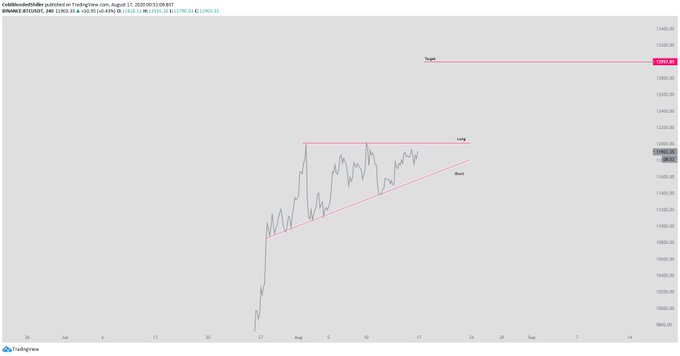
This Textbook Chart Pattern Predicts Bitcoin Will Hit $13,000 Imminently
Bitcoin has stalled despite posting a weekly close above the pivotal $11,800 level that analysts eyed. BTC remains in a textbook bullish chart pattern. That pattern is an ascending triangle, which has been a pattern of importance throughout Bitcoin’s history. дальше »
2020-8-18 13:00 | |
|
|

Chainlink Is Currently Having Its Pump and Dump Moment, Says Crypto Whale
Chainlink is a crypto project that has been hitting the headlines of late. The crypto recently surged by a huge margin before slowing down to trade at around $18. At the moment, Chainlink is number 5 on the chart according to CoinMarketCap. дальше »
2020-8-16 16:09 | |
|
|

Raoul Pal On Why Bitcoin Is Set To Be The Best Performing Major Asset In The World Over The Next 24 Months
Macro investor Raoul Pal said despite the recent price rally, Bitcoin still has a long way to go and that could eventually put it at the million-dollar mark in the next 5 years. In a recent tweet, Pal examined Bitcoin’s long-term chart, which has recently broken out of consolidation. дальше »
2020-8-13 00:58 | |
|
|
Daily Chart Suggests Bitcoin At Risk of Extended Correction To $10,500
Bitcoin struggled to clear the $12,000 resistance zone and corrected lower against the US Dollar. BTC’s daily chart suggests the price could extend its decline towards the $10,500 support. Bitcoin topped near the $12,080 level and it is currently correcting gains. дальше »
2020-8-12 06:58 | |
|
|

Economist: Early Days of Bitcoin Uptrend Are Here, Breakout Has A Long Way To Go
Bitcoin price is on fire again, after spending three full months trading sideways. After busting through resistance at $10,000 and out of its downtrend, the asset quickly rocketed to over $12,000. Still, one economist says that this is just the “super early days” of Bitcoin’s next uptrend. дальше »
2020-8-11 04:00 | |
|
|
Tezos (XTZ) Is Preparing For Another Leg Higher as Chart Strengthens: Analysts
Tezos (XTZ) has been one of the best-performing cryptocurrencies of the past few days. The cryptocurrency surged approximately 15% this weekend once it cracked the pivotal $3. 40 resistance. XTZ now trades for $3. дальше »
2020-8-11 03:00 | |
|
|
Bitcoin’s Macro Price Chart Is Giving a Fund Manager “All-Time High Vibes”
Bitcoin has seen a strong retracement since its highs of $12,200 set on Saturday. Bulls remain optimistic about the leading cryptocurrency. One fund manager in the space went as far as to say that the BTC chart is giving him “all-time high” vibes. дальше »
2020-8-6 04:00 | |
|
|
Chainlink Competitor Band Protocol (BAND) Surges 45% In 5 Minutes: Here’s Why
It seems that the days of explosive crypto gains are back. In the span of about five minutes, Band Protocol (BAND) gained approximately 45% against the U. S. dollar as buying volume surged. The chart below is from Alex Kruger, an analyst in the cryptocurrency space. дальше »
2020-8-6 01:42 | |
|
|

Winklevoss Twins Predict Big Week For Bitcoin As Battle For $12k Reignites
After a few days of sideways trading, it seems that Bitcoin bulls have roused and are pushing BTC towards $12,000 again. The current price of Bitcoin is around $11,697 with positive momentum. On the daily chart, the first-ranked digital asset is not facing a lot of resistance until $12,123, but of course, the $12,000 psychological […] дальше »
2020-8-6 22:57 | |
|
|
Cardano long-term price analysis: August 2
Cardano currently stands at 8th rank with a market cap of $3.46 billion. With the coin trading at $0.1329, the coin is stuck moving sideways with no proper destination in sight. Cardano 1-day chart The post Cardano long-term price analysis: August 2 appeared first on AMBCrypto. дальше »
2020-8-3 00:04 | |
|
|
IOTA Signals Bull Run After Forming Its First Weekly Golden Cross
IOTA, a transaction settlement token for the Internet of Things (IoT), has surged by more than 400 percent from its March 2020 nadir. Its price rally this week led to the formation of its first Golden Cross on a weekly chart. дальше »
2020-7-31 16:04 | |
|
|
Why Analysts Think XRP Has The “Worst Looking Chart” in the Crypto Market
XRP’s price rallied overnight and is finally starting to see some of the momentum that has recently been incurred by the rest of the crypto market Despite this, analysts are noting that there are some troubling signs regarding the crypto’s near-term strength As a result of these signs, one analyst is even going so far as to note that XRP has one of the worst charts of all cryptocurrencies He explained that its upwards price […] дальше »
2020-7-30 23:00 | |
|
|
Why Bitcoin May Be In For a Fall Towards $6,000
Bitcoin risks plunging back towards $6,000 purely based on a historical technical setup. The analogy appears after switching a BTC/USD chart from normal to a more precise logarithmic scale. It shows that the cryptocurrency has not precisely broken above its long-term descending trendline resistance. дальше »
2020-7-29 14:00 | |
|
|
Ethereum gas price and risks mainly driven by DeFi
The Ethereum market has been noticing a spike in its value given the surge in the Bitcoin market. This spike was of 11%, however, according to the daily chart of Ethereum, it has been marching upwardsThe post Ethereum gas price and risks mainly driven by DeFi appeared first on AMBCrypto. дальше »
2020-7-28 23:30 | |
|
|

Bitcoin Chart Allegedly Linked to Citibank Projects Price at $120K
Bitcoin price could hit $120,000 in the coming years, according to a chart with alleged links to Citibank. The unverified image, first shared by Altana Digital Currency’s CIO Alistair Milne, depicts Bitcoin in a 2. дальше »
2020-7-27 14:00 | |
|
|

Historical Data Reveals Bitcoin On The Cusp Of Having Its First Post-Halving Moonshot
If historical data can predict the future, then we are on the cusp of a massive bull run in 10 weeks after the 3rd Bitcoin halving. Analyst Josh Rager posted a Bitcoin chart with emphasis on when the halving took place. дальше »
2020-7-25 13:26 | |
|
|