Chart - Свежие новости [ Фото в новостях ] | |

Michael Saylor Drops Three Words as Bitcoin Rebounds: Did Strategy Buy $60,000 BTC Dip?
Michael Saylor posted "Orange Dots Matter" hint over a chart showing 713,502 BTC holdings during Bitcoin's crash to $60,000 and rebound to $71,000, hinting at a possible buy by Strategy. дальше »
2026-2-10 18:46 | |
|
|
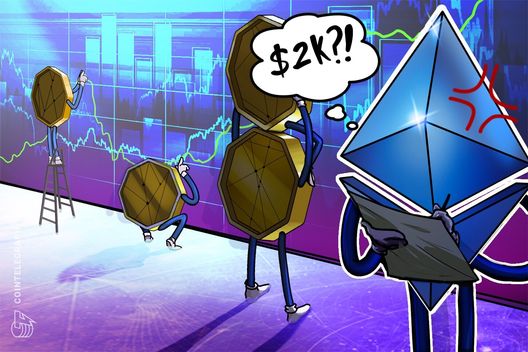
Ethereum price confirms inverted H&S as staking queue soars
Ethereum price could be preparing a strong rebound after forming a giant hammer candle and confirming the inverted head-and-shoulders chart pattern as the staking queue jumps to a record high. Ethereum (ETH) token was trading at $2,080, up sharply from… дальше »
2026-2-9 15:57 | |
|
|
Cardano Price Forecast 2027: What Happens to $5,000 Invested in ADA Today?
Cardano is in a rough spot right now, no way around it. The ADA price has been dragged down by a market that’s still stuck in fear mode, and momentum hasn’t exactly been friendly. But the chart also doesn’t tell the full story. дальше »
2026-2-8 02:15 | |
|
|
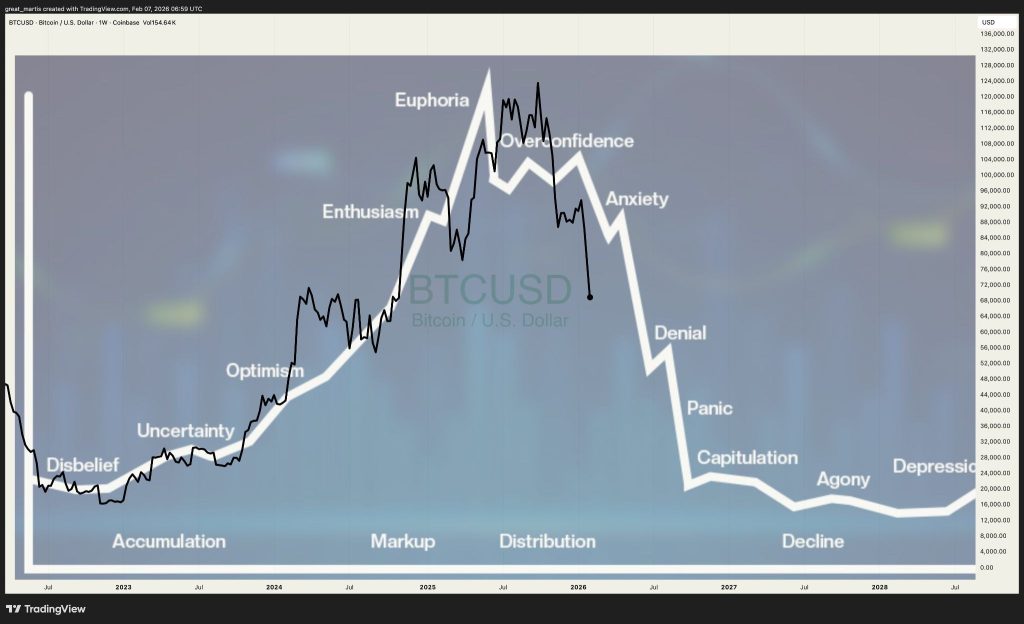
The Stock Market Cycle Chart Is Screaming One Thing: Bitcoin’s Euphoria Is Over
Bitcoin hasn’t been acting like a market that’s casually heading into new all-time highs. The price movements in BTC are following a well-trodden path for traders, the moment when the initial sparkle fades a little, nerves get a bit frayed, and the mood changes before most people are aware of it. дальше »
2026-2-8 00:00 | |
|
|

Bitcoin hits price level it always defend and the current BTC mining cost matters
Trader Plan C recently surfaced a chart indicating a production-cost model placing Bitcoin's marginal mining expense at approximately $67,000, with historical price action showing repeated bounces off that red line. дальше »
2026-2-9 16:30 | |
|
|
Bitcoin now at a price level it has always defended and the current $67,000 BTC mining cost matters
Trader Plan C recently surfaced a chart indicating a production-cost model placing Bitcoin's marginal mining expense at approximately $67,000, with historical price action showing repeated bounces off that red line. дальше »
2026-2-7 16:30 | |
|
|
XRP Still in Bull Market Versus Bitcoin, and XRP/BTC Chart Puts 51% Upside on the Menu
XRP just avoided a major breakdown vs. Bitcoin by holding the monthly Bollinger midband; now a 51% rally is back on the table as the XRP/BTC chart flashes a rare bullish signal ignored by most market players. дальше »
2026-2-10 08:30 | |
|
|
Analyst Who Predicted XRP’s 600% Rally Forecasts The Bottom And A Target Of $10
XRP’s current pullback has diverted attention away from short-term volatility and back toward the bigger picture on the chart. The cryptocurrency is now down by over 60% from its July all-time high, and the decline is showing signs of more downside. дальше »
2026-2-7 01:00 | |
|
|
“Never a Better Time to Rack Up SHIB,” Analyst Says as Shiba Inu Price Hits a Historic Floor
Shiba Inu is back in a part of the chart that traders have had their eyes on for a long time. The SHIB price has been sliding lower for months, and now it has finally reached the zone that analyst Vivaforexwithcaro calls the most important support level in the entire setup. дальше »
2026-2-7 23:30 | |
|
|
Ethereum weakens after Bitcoin plunge, downside risks build
Ethereum price is trading inside a huge channel on the monthly chart. Bitcoin’s crash to $60,000 dragged ETH to its intraday lows. After falling to lows of $1,748, ETH risks another leg down. дальше »
2026-2-7 18:46 | |
|
|
Why Bitcoin's $60,000 Hit Is Becoming New Crypto Legend
After a brutal $13,000 crash in a single day, Bitcoin stopped dead at exactly $60,000.00 across major exchanges, not a cent more, not a cent less, prompting the market to call it the strangest chart event since Satoshi disappeared. дальше »
2026-2-10 17:34 | |
|
|
Here’s Where Silver Price Could Be Headed Next If $71 Support Breaks
The Silver (XAG) price is sliding again, and traders are watching one level more than anything else right now. Spot silver is down hard, and the chart is starting to look shaky after a weak bounce. дальше »
2026-2-6 01:00 | |
|
|

Bitcoin in critical warning zone threatening a 42% drop before the new bull run can start
Bitcoin is back in that familiar place where the chart looks ugly, the timeline feels loud, and everyone is trying to guess whether the next move is the one that finally breaks the mood. Today, Bitcoin fell below $70,000 for the first time in well over a year. дальше »
2026-2-6 17:10 | |
|
|
Bitcoin hits critical warning zone threatening a 42% drop before the new bull run can start
Bitcoin is back in that familiar place where the chart looks ugly, the timeline feels loud, and everyone is trying to guess whether the next move is the one that finally breaks the mood. Today, Bitcoin fell below $70,000 for the first time in well over a year. дальше »
2026-2-6 17:10 | |
|
|
Why is Hyperliquid price up 6% despite crypto market bloodbath?
Hyperliquid price is rallying against the market tide as institutional adoption and improving chart structure attract fresh buyers. Hyperliquid was trading around $34.96 at press time, up 6% in the past 24 hours, even as the crypto market sold off… дальше »
2026-2-5 07:49 | |
|
|
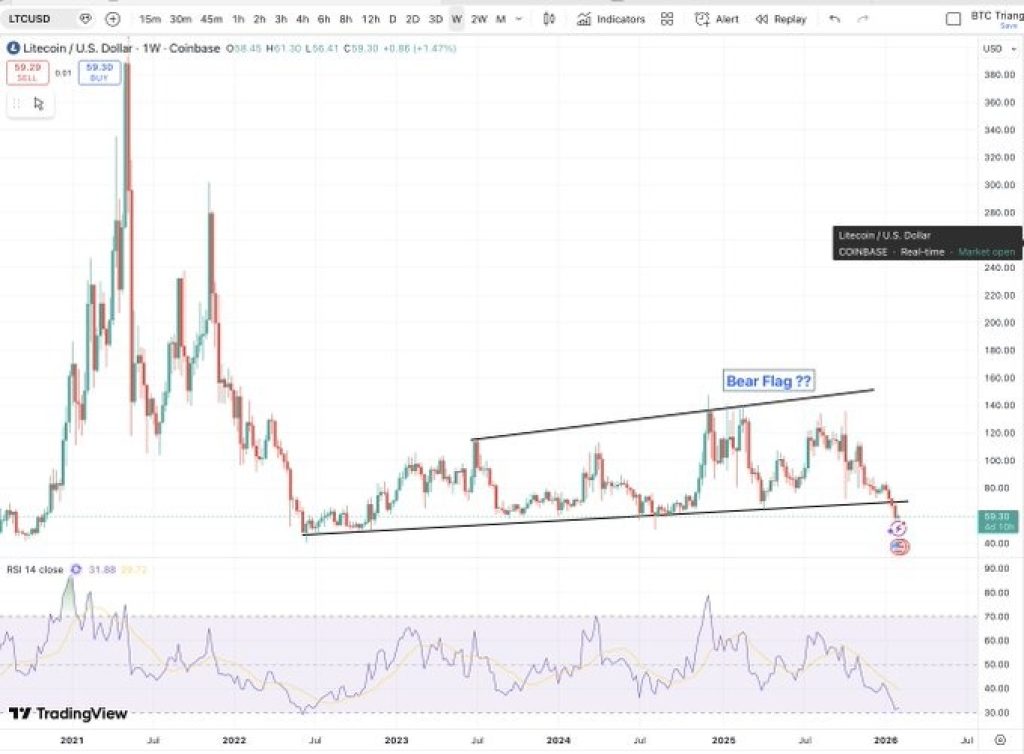
Litecoin Chart Looks Ugly: Is a Bigger Drop Next for $LTC Price?
The Litecoin (LTC) price is not breaking out right now. It is breaking down. A chart shared by Matthew Dixon is putting attention on one bearish setup: a possible bear flag. This pattern shows up when a coin drops hard, then drifts sideways before sellers step back in. дальше »
2026-2-5 00:30 | |
|
|
Silver Price to $800? Why the Bull Market Is Far From Over and Just Beginning
The Silver (XAG) price just broke a structure that had capped price for hundreds of years. That is the claim behind a chart now circulating among long-term commodity traders. That view comes from Graddhy, an analyst followed by more than 100,000 traders who focuses on long-term price structure and historical cycles. дальше »
2026-2-4 21:00 | |
|
|


One Bitcoin Chart Correctly Predicts the 5% Bounce — But 3 Metrics Now Question It
The Bitcoin price saw a short-term rebound after slipping to recent lows, gaining nearly 5% from its late-January bottom to test the $76,980 zone. This BTC price move followed a bullish momentum setup on the 4-hour chart, where selling pressure appeared to weaken. дальше »
2026-2-4 10:56 | |
|
|

Dogecoin ($DOGE) Is Back at the Level That Triggered a 17,000% Explosion
The Dogecoin price is trading at a level that has mattered before. Very few price zones on any chart can claim to have launched a full cycle move. This one can. DOGE is sitting near the same area that marked the base before its historic 2021 expansion. дальше »
2026-2-4 00:00 | |
|
|

Galaxy Digital stock flags a dangerous pattern as losses jump
Galaxy Digital stock price remains in a technical bear market after plunging by nearly 50% from its highest level in 2025, and a risky chart pattern points to more downside as its losses rise amid the crypto market crash. дальше »
2026-2-4 18:51 | |
|
|
5 Reasons You May Not Want to Ignore Hedera (HBAR) in 2026
Looking at price action alone does not tell the full story of what is happening with a crypto project. Hedera is trading close to 80% below its January 2025 price. That drawdown looks heavy on the chart; however, several deeper signals suggest ignoring HBAR in 2026 could be a mistake. дальше »
2026-2-3 12:30 | |
|
|
Solana (SOL) Fell 60%: Analyst Who Warned Early Explains What Comes Next
Solana price drift followed a clear structure that had already been mapped out on higher time frames. That structure is now shaping the next phase for SOL price, and the latest chart shared by Crypto Patel on X explains why this zone matters a lot. дальше »
2026-2-3 10:30 | |
|
|
Analyst Highlights What People Are Missing In The XRP Price Chart
An XRP analyst is pushing back against the growing sense of boredom surrounding XRP’s price action, with the outlook that people are misreading what is actually happening on the higher timeframes. Taking to the social media platform X, an analyst known as XRP QUEEN said traders are overlooking a typical setup that has always preceded some of XRP’s most notable rallies. дальше »
2026-2-3 23:00 | |
|
|
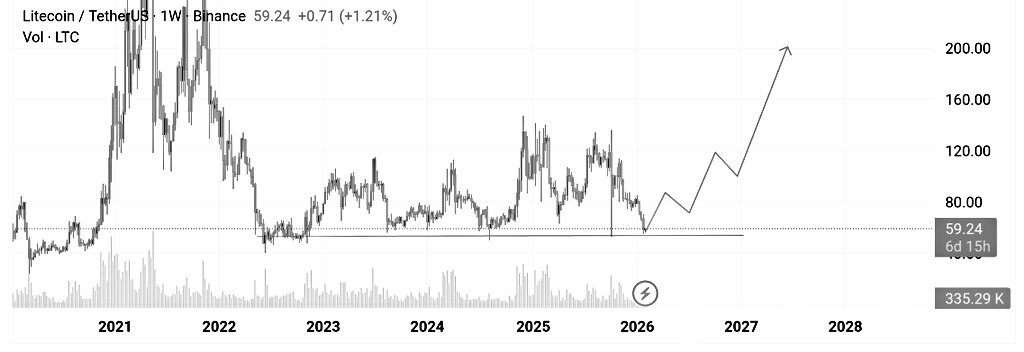
This Forgotten Litecoin (LTC) Price Zone Could Be the Catalyst for a $100 Move
At a glance, the weekly chart shared by Erick Crypto tells a pretty straightforward story. The LTC price is still hanging out in the same support zone it’s been defending for years. With Litecoin trading around $59, the price is right in that $55–$60 area that keeps showing up as a line buyers are willing […] The post This Forgotten Litecoin (LTC) Price Zone Could Be the Catalyst for a $100 Move appeared first on CaptainAltcoin. дальше »
2026-2-3 22:30 | |
|
|
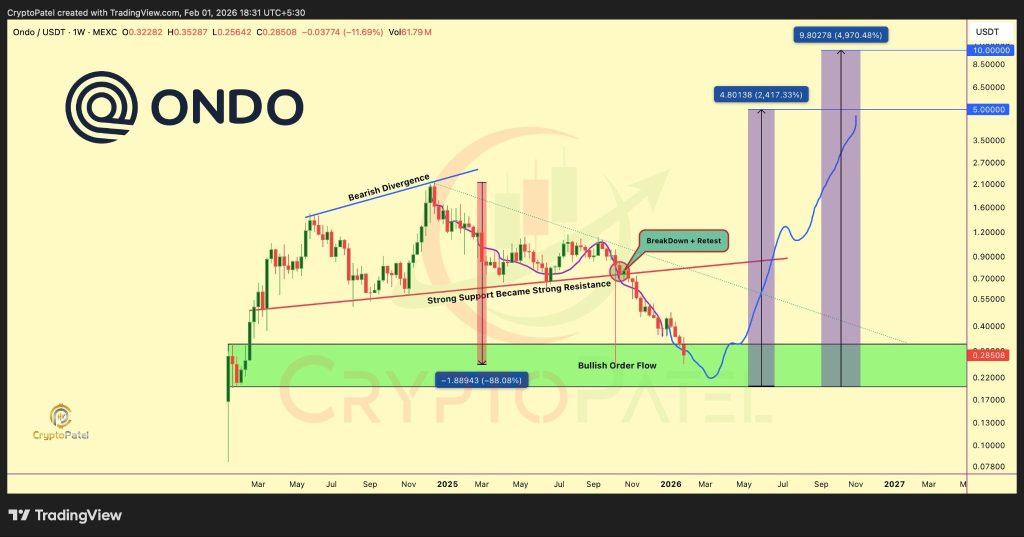
ONDO Price Crashes 88% From All-Time Highs, But Analyst Says ‘Last Hope’ Zone Is Here
The ONDO price has drifted into a part of the chart that usually gets traders paying attention. After months of downside, the price is now sitting inside a zone that has mattered in the past. This isn’t a quick dip on a short timeframe. дальше »
2026-2-3 21:30 | |
|
|
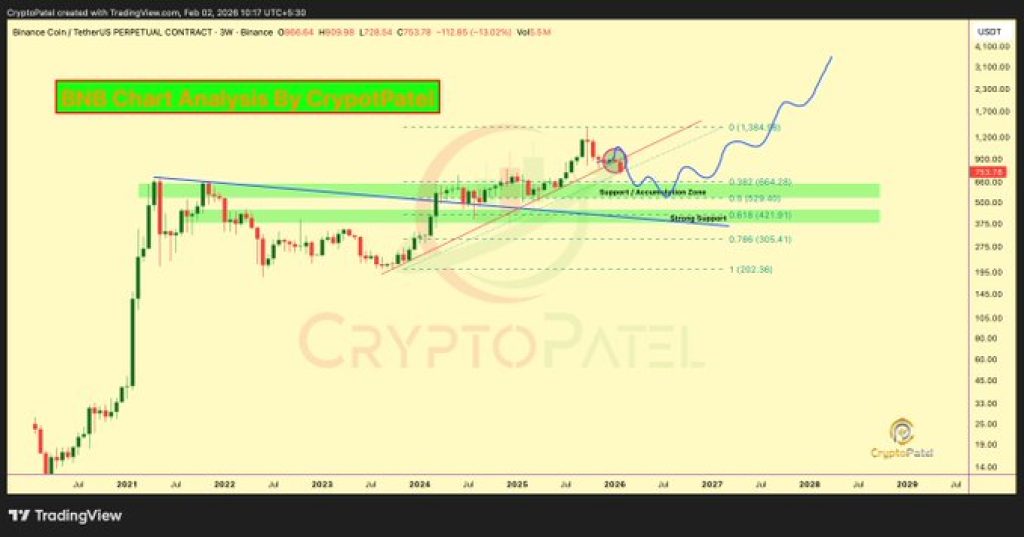
Binance Coin (BNB) Price Drop Wasn’t an Accident – This Analyst Says the Real Opportunity Is Here
Binance Coin (BNB) took a heavy hit. The BNB Price is down about 47% from its all-time high near $1,374 and traded into the $530–$420 area. The drop looked ugly, but some traders say it followed the chart closely. дальше »
2026-2-3 18:00 | |
|
|
PEPE Price Is Running Out of Room – Here’s What’s Happening
The PEPE price is trading near a tight area on the chart, and it no longer has much space to move without choosing a direction. After months of steady fading, the structure has compressed, and traders are watching closely for the next move. дальше »
2026-2-2 02:30 | |
|
|
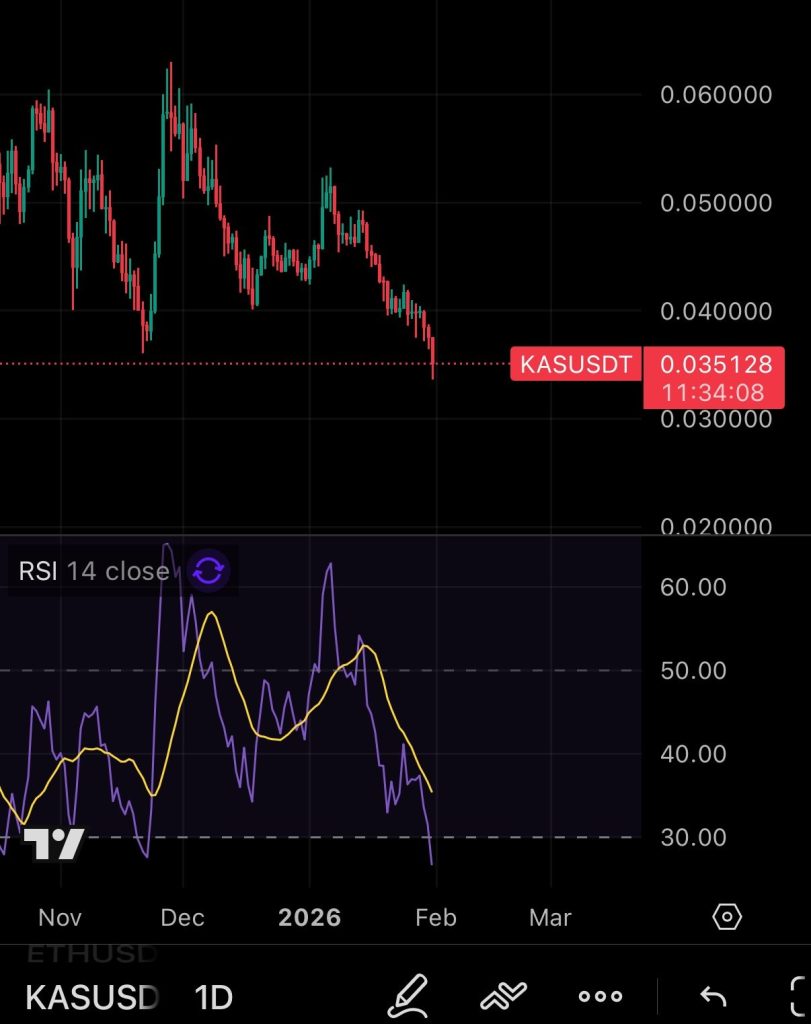
KAS Price Outlook: Oversold Conditions Put Kaspa at a Decision Point
Kaspa has been taking some heat lately, and the daily chart is starting to show the effects. As pointed out by KaspaDaily, the KAS price has now slipped into oversold territory on the daily RSI. That’s usually a sign that selling pressure is getting stretched and that the market may need a pause. дальше »
2026-2-1 01:00 | |
|
|

SUI Price Outlook: Is SUI at the Stage Where Big Money Enters?
The SUI price is back in focus, and this time it’s not because of a quick spike or social hype. A weekly chart shared by Crypto Patel is getting a lot of attention because it shows something more structural, not something driven by short-term excitement. дальше »
2026-2-1 22:00 | |
|
|

Grab 190M Daily Before It’s Gone: ZKP Emerges as Crypto’s First Presale Auction While AVAX and ETH Hit the Brakes
Once dominant cryptocurrencies pause at critical thresholds, focus organically transitions toward opportunity construction rather than valuation velocity. The Ethereum price chart demonstrates this uncertainty plainly, with ETH encountering distribution pressure underneath clearly marked resistance territory following current recovery efforts. дальше »
2026-2-1 20:00 | |
|
|
XRP Short-Term Price Outlook: Reversal Not In Sight Yet
XRP price has spent weeks grinding lower, and the chart now tells a story that feels tense rather than dramatic. Price continues to respect a downward channel, sliding under key averages and testing trader patience. дальше »
2026-1-31 13:17 | |
|
|
This Ethereum Chart Looks Like Gold Before Its 250% Run: Altcoins Could Outperform Everything
Crypto analyst Mark shared a chart comparison that is quickly circulating across trading desks, and the message is simple but bold: Ethereum is tracking the same structure gold printed before its explosive breakout. дальше »
2026-1-31 12:00 | |
|
|

Zcash (ZEC) Price Prediction: More Downside Coming
Zcash is starting to lean heavily on local support after another rough daily candle, with price hovering around $336. On the chart, that support line is basically the last thing stopping a deeper slide. дальше »
2026-1-30 21:30 | |
|
|

Bitcoin Rainbow Chart Signals ‘Fire Sale’ Zone as BTC Enters Undervalued Territory
Bitcoin Magazine Bitcoin Rainbow Chart Signals ‘Fire Sale’ Zone as BTC Enters Undervalued Territory Bitcoin has dropped into historically “fire sale” levels on the Bitcoin Rainbow Chart, signaling deep undervaluation. дальше »
2026-1-31 20:26 | |
|
|
Does Bitcoin's 9% volatility surge signal more BTC downside?
Bitcoin's [BTC] slips below $84,000 ahead of the option's expiry, and the timing matters. Bitcoin's price trends are lower on the daily chart, forming lower highs since October, which signals weakeThe post Does Bitcoin's 9% volatility surge signal more BTC downside? appeared first on AMBCrypto. дальше »
2026-1-30 20:00 | |
|
|

Bitcoin (BTC)Price Structure Just Cracked – Why $70K Is Back in Play
The Bitcoin price just lost an important level, and the chart is starting to look heavy again. Price dropped under $85,000 and is now trading near $84,400. This move did not come out of nowhere. дальше »
2026-1-30 00:30 | |
|
|
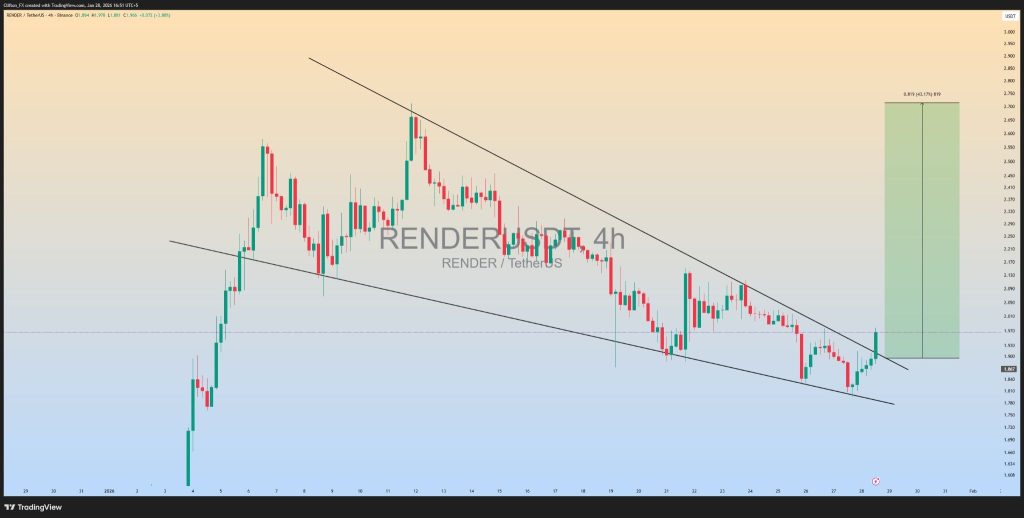
Render (RENDER) Price Holds a Level That Could Define the Next Move
RENDER is finally showing signs of a shift on the 4-hour chart. After weeks of grinding lower inside a falling wedge, price has pushed through the upper trendline and now, it moves away from it. That matters, because this kind of structure usually breaks when selling pressure runs out instead of when sellers are in […] The post Render (RENDER) Price Holds a Level That Could Define the Next Move appeared first on CaptainAltcoin. дальше »
2026-1-30 00:30 | |
|
|
Here’s Why Ripple’s XRP Price Could Hit $200
The XRP price has pulled back with the rest of the market, but one chart keeps coming up in trader discussions. It is a price channel that has guided XRP since 2014. Some analysts believe this structure still matters today. дальше »
2026-1-30 21:30 | |
|
|

XRP Prints Bullish Divergence On The Weekly Chart, But Is ATHs Still Possible?
After months of compressed price action, XRP is back in focus after a widely followed crypto trader on X highlighted a significant shift on the weekly chart. The asset is now showing a technical signal that has historically appeared near major turning points, sparking debate over whether this setup can realistically support a move back toward XRP’s prior all-time highs. дальше »
2026-1-29 20:00 | |
|
|
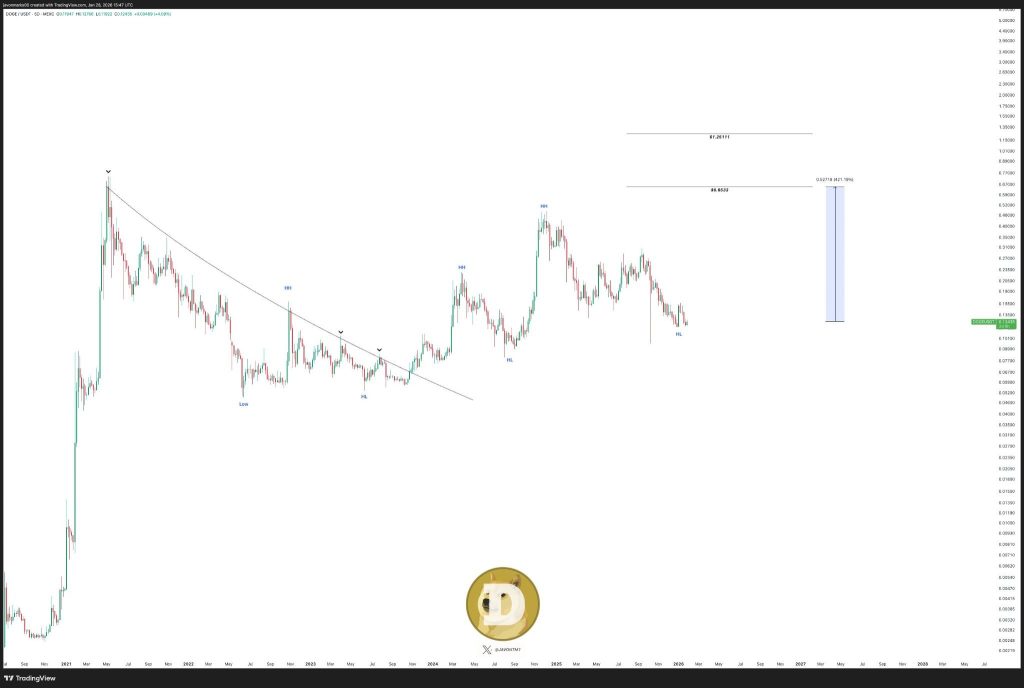
Dogecoin (DOGE) Price Prediction: Analyst Points to a Possible Move above $1.25
The idea behind Javon Marks’ take is pretty simple, and the chart makes it easy to follow. After spending a long time stuck under a curved downtrend that capped rallies through 2021, 2022, and much of 2023, the DOGE price finally broke above that resistance. дальше »
2026-1-29 18:45 | |
|
|
Kaspa (KAS) Price Prediction for February: Recovery Remains Unlikely
Kaspa is wrapping up another difficult January, ending the month lower than it started and extending a trend that has been weighing on the asset for months. Price action is now close to a major support zone, and the chart suggests February could be a decisive period rather than a turning point. дальше »
2026-1-29 15:30 | |
|
|

Bitcoin Death Cross That Last Preceded A 66% Drop Is Back
A cryptocurrency analyst has pointed out how Bitcoin has recently formed a technical crossover that preceded bearish shifts in the past. Bitcoin Has Seen A Death Cross Between 21-Day & 50-Day SMAs In a new post on X, analyst Ali Martinez has shared a daily price chart for Bitcoin showcasing a crossover between two simple moving averages (SMAs) that the asset has gone through recently. дальше »
2026-1-29 09:00 | |
|
|