Chart - Свежие новости [ Фото в новостях ] | |


XRP News: $1.50 Is in Sight, While Solana Reacts; But for DeepSnitch AI, a Crypto Explosion of 150x Returns Seems Almost Inevitable for 2026
XRP latest news has been positive, as the giant altcoin seems to be entering a new recovery momentum, with potential for reclaiming key marks in its price chart. This has coincided with several Ripple ecosystem updates that show how, despite the current downturn in crypto, XRP continues to be adopted by institutional players. дальше »
2026-2-23 00:30 | |
|
|

Bitcoin flash crashes below $65,000 in delayed reaction to more Trump tariff hikes during low weekend liquidity
Bitcoin traded sideways before drop as Trump cited Trade Act for 15% tariffs after Supreme Court ruling, and the market starts watching the 150-day clock It was one of those rare weekend sessions where the chart barely moves… yet it still feels like something was about to snap. дальше »
2026-2-23 15:20 | |
|
|
Bitcoin enters a 150-day danger zone as Trump pivots to a 1974 trade law the Supreme Court hasn’t touched yet
Bitcoin trades sideways as Trump cites Trade Act for 15% tariffs after Supreme Court limits IEEPA authority, and the market starts watching the 150-day clock It is one of those rare weekend sessions where the chart barely moves… yet it still feels like something is about to snap. дальше »
2026-2-23 15:20 | |
|
|

Ethereum Price Looks Bullish, But Only On The Inverted Chart
Ethereum shows signs of strength, but the bullish picture only emerges on an inverted chart. On the standard view, the downtrend remains intact until key resistance is reclaimed, making the current optimism conditional. дальше »
2026-2-23 01:00 | |
|
|
Bitcoin’s Deepest Corrections in History: The Real Pain May Not Be Over
The chart shared by Crypto Patel puts Bitcoin’s current drawdown into long-term perspective by mapping every major peak-to-trough decline since 2011. What immediately stands out is not just how brutal past bear markets were, but how consistently Bitcoin has tested investor conviction before resetting for the next cycle. дальше »
2026-2-21 20:30 | |
|
|

Pressure Builds on ADA Despite Cardano’s Bold Behind-the-Scenes Push
Cardano (ADA) remains under pressure on the 4-hour chart, trading inside a descending channel after rejecting the $0.38–$0.40 range. дальше »2026-2-23 17:07 | |
|
|
Veteran Analyst Who Nailed XRP Crashes Warns Ripple Price Is Headed Below $1
XRP price has entered the kind of zone that makes chart watchers stop scrolling and zoom in. Ripple price has slipped under a long-term support level that traders track across multiple cycles. That break sets up a serious question. дальше »
2026-2-21 17:00 | |
|
|
Gold, silver climb on US–Iran tensions as BTC tests support
Gold and silver gain on US–Iran tensions as BTC retests key chart resistance. Gold and silver prices advanced Friday amid heightened geopolitical tensions between the United States and Iran, with analysts monitoring whether Bitcoin will follow traditional safe-haven assets higher.… дальше »
2026-2-20 14:32 | |
|
|

Optimism (OP) Price Down 97% From ATH – Is This Token Basically Finished?
Optimism (OP) has been absolutely crushed. The token is now down roughly 97% from its all-time high, and the last month alone has brought another steep leg lower. It’s the kind of chart that makes people ask the obvious question: does this token even have a future, or is it basically finished? Altcoin Sherpa summed […] The post Optimism (OP) Price Down 97% From ATH – Is This Token Basically Finished? appeared first on CaptainAltcoin. дальше »
2026-2-20 00:30 | |
|
|

This Analyst Was Spot On About Zcash (ZEC) Price
Zcash (ZEC) pumped hard, but it hasn’t been able to hold up near the highs. Price is now stalling, and the chart is starting to look weak again. Crypto analyst Cryptorphic shared a clear warning on ZEC, saying that the real move may still be down. дальше »
2026-2-20 20:30 | |
|
|

Dogecoin price tests $0.1 as this chart pattern hints at possible rebound
Dogecoin struggles below key moving averages, signaling weak short-term trend. A cup and handle pattern is forming, hinting at a potential breakout if the resistance breaks. Support lies near $0. дальше »
2026-2-18 20:31 | |
|
|
Ethereum price forms death cross as ETF outflows extend into fourth month, will it crash?
Ethereum price has confirmed a dreaded death cross pattern on the weekly chart. Will it crash as demand for its ETFs continues to falter? According to data from crypto.news, Ethereum (ETH) price has plummeted since mid-January this year. Trading around… дальше »
2026-2-18 13:14 | |
|
|
OBV rises, price falls: Why TRUMP’s 'buy' signals may be misleading
The Official Trump [TRUMP] memecoin was down 95.4% from its all-time high. A recent AMBCrypto report highlighted the imbalance between $3.57 and $4.09 on the daily chart. On Saturday, the 14th of FThe post OBV rises, price falls: Why TRUMP’s 'buy' signals may be misleading appeared first on AMBCrypto. дальше »
2026-2-18 04:00 | |
|
|

Metaplanet stock falls as massive Bitcoin bet backfires
Metaplanet stock edged up just about 3% on the daily chart following the earnings release, but the broader trend remains under pressure. Despite the short-term bounce, the stock is still down roughly 37% over the past month, highlighting investor concerns… дальше »
2026-2-18 11:55 | |
|
|
Hedera (HBAR) Chart Shows Two Scalping Targets After the Weekly Rally
The HBAR price has been holding up pretty well lately. Hedera is currently trading at around $0. 102, up about 1. 6% over the last day, having had a strong week with a 14% rise. In a market that still feels a bit uncertain, this sort of steady rise is certainly noticeable. дальше »
2026-2-17 01:30 | |
|
|

Solana price prediction: Will SOL reclaim its $200 highs in 2026?
Just over a week ago, AMBCrypto reported that a head and shoulders pattern on the Solana weekly chart could take the price to $47. The weekly chart and its Fibonacci extension level agreed with this tThe post Solana price prediction: Will SOL reclaim its $200 highs in 2026? appeared first on AMBCrypto. дальше »
2026-2-17 00:00 | |
|
|
Historic Trend That Led XRP To A Sharp 40% Trend Has Just Reappeared
XRP may be approaching a significant technical moment after returning to an important level on the XRP/BTC chart. A crypto analyst known as Austin recently highlighted that the last time XRP broke above a specific resistance against Bitcoin, the result was a rapid and powerful price expansion. дальше »
2026-2-17 20:30 | |
|
|
Cardano price chart points to more downside as key ecosystem metrics plunge
Cardano price was stuck in a tight range on Monday, mirroring the performance of other cryptocurrencies. дальше »
2026-2-17 20:26 | |
|
|
Bittensor price forecast as TAO hits $200 resistance amid Upbit listing
Bittensor price rose to highs of $207 amid Upbit’s listing announcement. However, buyers retreated and saw TAO touch lows of $179. The daily chart signals a potential bullish move, and $300 could be the next target. дальше »
2026-2-17 14:27 | |
|
|
Bitcoin price confirms bullish divergence as liquidations spike, eyes $71k resistance
Bitcoin price has confirmed a bullish divergence on the daily chart as liquidation levels shot up on Monday. The daily chart for Bitcoin shows that its Relative Strength Index has formed a bullish divergence with its price, which has been… дальше »
2026-2-16 10:50 | |
|
|
Bitcoin Price Crash to $39K? This Bear Market Bottom Metric Says the Pain Isn’t Over
Bitcoin is trading around $68K right now, but a CryptoQuant chart making the rounds is putting a much lower number back on the table: $39K. The logic comes from one of the most watched on-chain “line in the sand” metrics in crypto cycles — realized price. дальше »
2026-2-16 00:30 | |
|
|
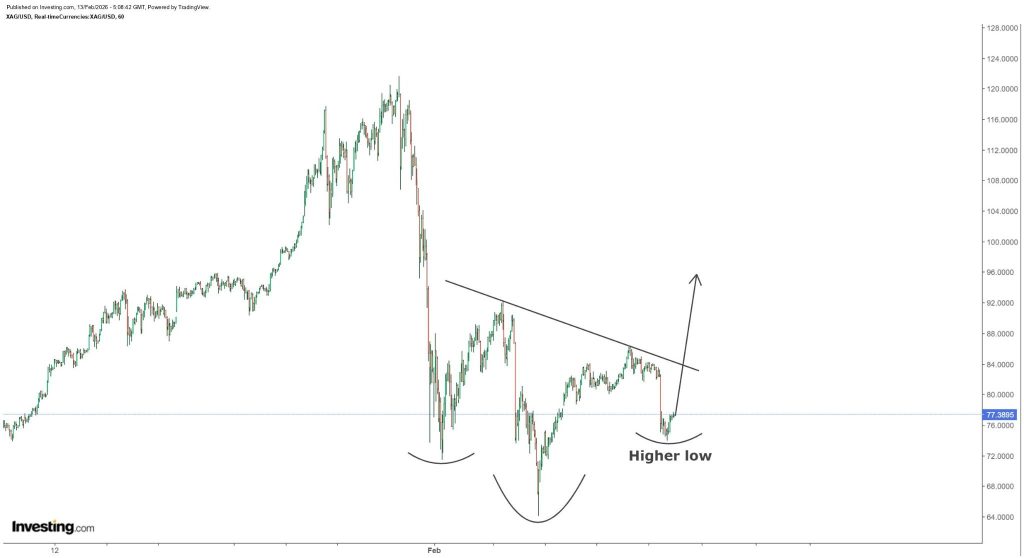
Silver Price Could Be Turning the Corner – This Chart Pattern Points to a Major Upside Push
Silver has been on a bit of a rollercoaster lately. After a strong push higher earlier this year, the silver price suddenly hit a rough patch. The market sold off hard, momentum cooled down fast, and it felt like bulls completely lost control for a moment. дальше »
2026-2-14 00:00 | |
|
|
ONDO Price Prediction: This Breakout Pattern Could Send ONDO to $0.85 Next
ONDO has quietly stayed on traders’ radars even through a pretty rough stretch for altcoins. After months of selling pressure, the price is finally starting to calm down near a major support area, and the chart is beginning to look a lot more interesting again. дальше »
2026-2-14 21:30 | |
|
|

Bitcoin Bears Are Overcrowded Again: Santiment Warns of a Liquidation Shock Rally
Bitcoin bears are crowded again, and Santiment’s chart is showing it in a way so it’s easy to notice it. With the BTC price sitting around $66,000, the “Funding Rates Aggregated By Exchange” visual is basically a positioning map: it tracks when perp traders, across multiple venues, are leaning so heavily to one side that […] The post Bitcoin Bears Are Overcrowded Again: Santiment Warns of a Liquidation Shock Rally appeared first on CaptainAltcoin. дальше »
2026-2-13 09:42 | |
|
|

VeChain (VET) Price Is Flashing the Same Breakout Pattern as 2 Months Ago – 40% Move Next?
VeChain (VET) is starting to show signs of life again after weeks of choppy price action. A new chart shared by trader Brain2jene suggests that the VET price may be repeating the same setup that played out just two months ago, and if the pattern holds, the next move could be sharp. дальше »
2026-2-13 04:00 | |
|
|
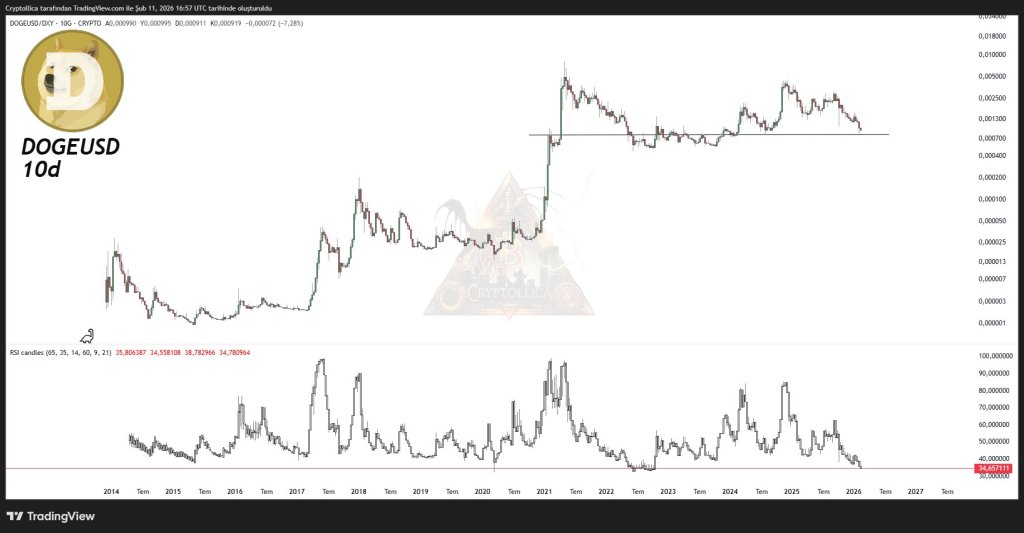
Dogecoin Is Now In The ‘Maximum Opportunity / Minimum Risk’ Zone: Crypto Analyst
Dogecoin is flashing what crypto analyst Cryptollica (@Cryptollica) calls on X a rare “maximum opportunity / minimum risk” setup, as long-horizon indicators on a DOGE-versus-dollar proxy chart push into levels that previously coincided with cycle lows. дальше »
2026-2-12 18:30 | |
|
|
Silver Price Pattern Reappears on XRP Chart and $7 Suddenly Looks Real
XRP price has returned to focus after a prolonged correction pushed the asset close to the $1 region before a modest rebound toward the mid $1 range. A short video analysis from Zach Rector, a top analyst on X, connects this phase of recovery to a historical breakout cycle in the silver market. дальше »
2026-2-12 18:00 | |
|
|
Bitcoin Cash - Analyzing why a drop below $500 might be good news for buyers
Bitcoin Cash [BCH] is one of the only top-10 crypto assets with a bullish weekly price chart. The second most-hopeful candidate seemed to be Binance Coin [BNB], but it has been laboring under the effeThe post Bitcoin Cash - Analyzing why a drop below $500 might be good news for buyers appeared first on AMBCrypto. дальше »
2026-2-11 04:00 | |
|
|
Virtuals Protocol (VIRTUAL) Is Quietly Printing Real Revenue While Crypto Sleeps
Most crypto moves are still driven by noise, hype, and short-term pumps. But every now and then, a project shows something real underneath the price chart. That’s what Virtuals Protocol is starting to do right now. дальше »
2026-2-11 01:00 | |
|
|
PEPE Price Ready to Rebound: These Critical Levels Decide the Next Move
PEPE has spent weeks sliding, then it started doing something traders always watch closely. The drop looks tired near a zone that has already been tested many times. Pepe Whale, known as @PepeEthWhale on X, summed it up in one line that fits the chart well. дальше »
2026-2-11 20:30 | |
|
|

Shiba Inu Price Prediction: Can SHIB Still Make Millionaires, or Is the Real Opportunity In Pepeto?
When looking for the best crypto opportunity, most people are looking at the price chart, but the real story is hidden in the wallet addresses. Everyone expects the legendary 2021 run to repeat exactly, but if you look closely, the market structure has shifted completely. дальше »
2026-2-9 17:30 | |
|
|
Ethereum price prediction after Tom Lee’s Bitmine buys 20K ETH worth $41.98M
Tom Lee’s Bitmine has moved closer to its goal of acquiring 5% of the total supply with its latest 20K ETH purchase. But a bearish flag pattern confirmed on the weekly ETH/USDT chart suggests a potential price correction for Ethereum… дальше »
2026-2-9 12:58 | |
|
|
Solana price stalls near $85 after mid-band rejection and trend failure
Solana price is hovering near $85 as falling volume, shrinking open interest, and a weak chart structure keep downside risk in focus. Solana was trading around $86.02 at press time, down 0.1% over the past 24 hours. The token has… дальше »
2026-2-9 10:06 | |
|
|
XRP price’s latest bounce lacks follow-through as sellers stay in control
XRP edged higher over the past 24 hours, rising roughly 2% in a modest relief move after last week’s sharp sell-off. But despite the uptick, the Ripple token’s (XRP) chart indicators suggest the bounce offers little cause for celebration, with… дальше »
2026-2-9 09:35 | |
|
|
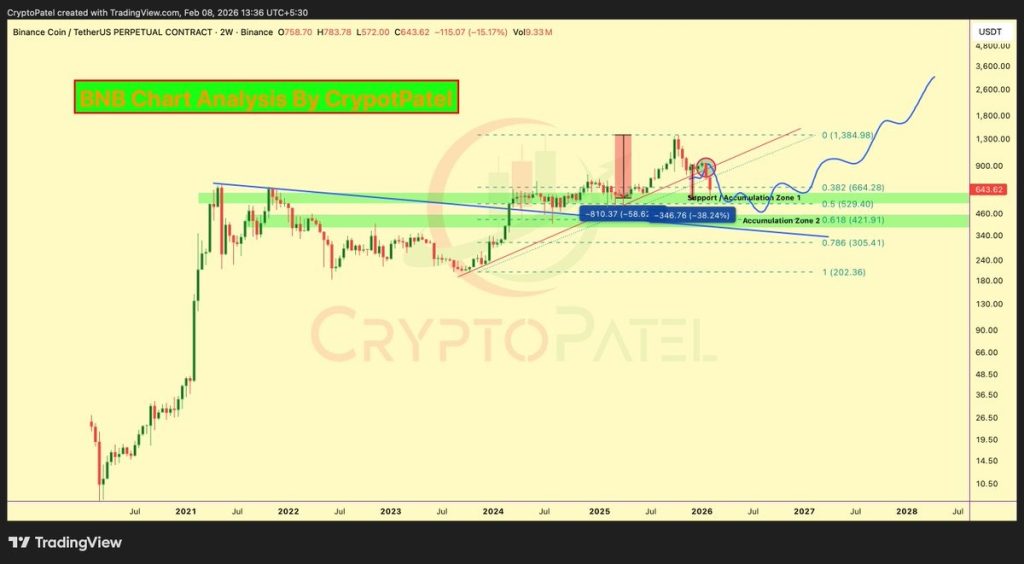
BNB Price Near the “Millionaire Zone” Again After a 60% Drop From Its ATH
BNB has taken a pretty nasty hit from its highs, and the BNB price is now back in the part of the chart where long-term traders start paying attention again. Not long ago, BNB was trading up near $900. дальше »
2026-2-9 00:30 | |
|
|
Aptos [APT] nears $1-support as $12.7M token unlock raises inflation fears
Aptos [APT] has been under sustained selling pressure for a while now, with the price consistently trending lower on the chart. In the last 30 days alone, APT recorded a 39% drawdown. Over a longer tThe post Aptos [APT] nears $1-support as $12. дальше »
2026-2-9 23:00 | |
|
|
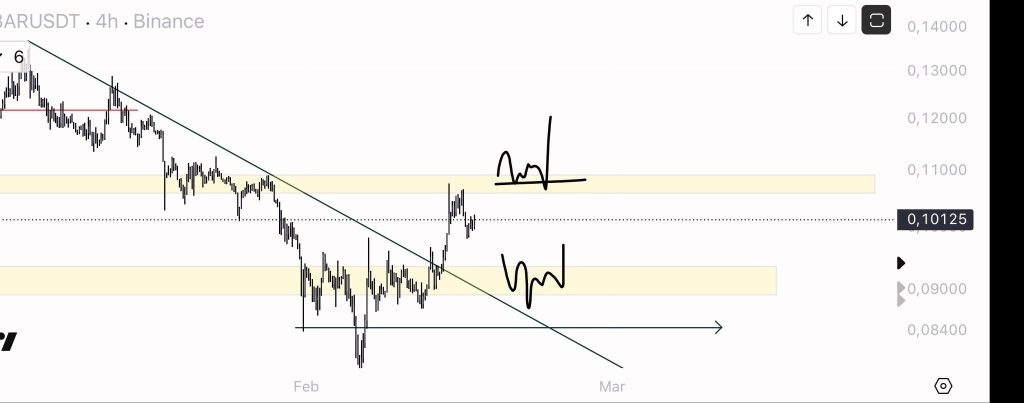
Here’s Where Hedera (HBAR) Could Be Headed This Week
Hedera has been in that awkward spot lately where the chart looks rough, but the fundamentals keep giving bulls something to hold onto. The HBAR price has been trending lower for most of the past few weeks, then suddenly it printed a sharp flush that felt like full-on capitulation. дальше »
2026-2-9 22:30 | |
|
|
Why Silver Price Could Be Headed for a New All-Time High
Silver just went through one of those drops that makes it feel like the whole story is finished. A slide from around $121 down into the mid-$60s looks nasty on the chart, and the first reaction is usually: okay, the bull market’s over. дальше »
2026-2-9 20:30 | |
|
|