Is Litecoin (LTC) Expecting A Pullback Before Soaring Again?

2023-1-24 19:00

The Litecoin price has shown bullish sentiment over the past week once it bounced off the $81 resistance zone. Over the last 24 hours, the altcoin jumped by 2%, and in the past week, the LTC price gained close to 6%.

As Bitcoin continues to trot upwards and is now eyeing the $23,000 price mark, other altcoins have reflected the same price sentiments. The technical outlook of the Litecoin price has depicted that accumulation shot past the overbought region just when Litecoin breached the $81 price region.

Demand for the coin remained steady between the $81 and $88 price levels, respectively. As Litecoin traveled above the $88 price zone, the coin started to display a price correction. Going by the indicators, Litecoin continues to remain heavily bullish on its chart, with another chance of a price retracement.

Bullish momentum has gained strength since it moved past the $86 price mark, which is why a move to the $90 mark was swift and easy for Litecoin. Historically, the $93 resistance mark has acted as a pullback region for the coin. LTC might reach the $93 level over the next trading session if Bitcoin continues to surge.
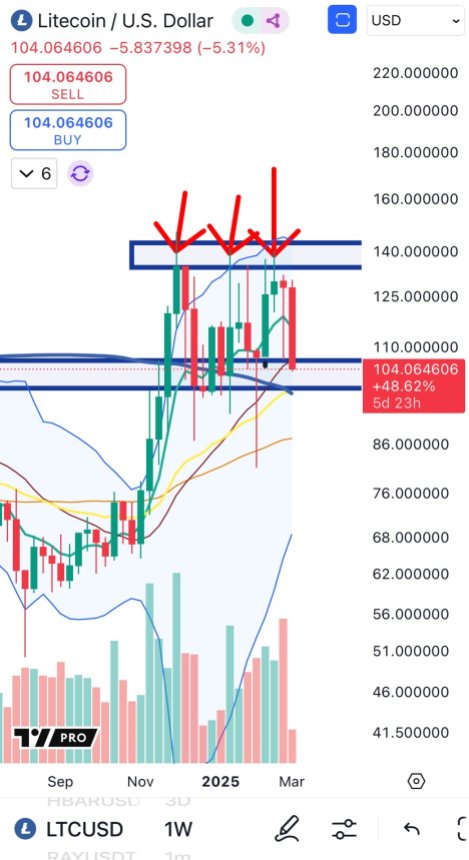
Litecoin Price Analysis: One-Day Chart

LTC was trading at $91 at the time of this writing. Over the past couple of weeks, Litecoin has pierced through several resistance levels. The coin faced stiff resistance at $81 and has been rallying since crossing that level.

Overhead resistance for the coin stood at $93; this will act as a crucial price mark because LTC can experience a pullback before it tries to breach the $106 resistance mark.

On the other hand, if Litecoin fails to remain above the $88 support line, it would lead to sellers exceeding buyers, causing the altcoin to fall to $80 and then $71. The amount of LTC traded in the last session was red, which signified that there was a fall in the number of buyers.

Technical Analysis

LTC hovered around the overvalued zone, which indicated that there would be another price correction before it started to trade upwards again. The Relative Strength Index (RSI) stood at the 70 mark, which indicated that the asset was overbought.

A fall from the overvalued zone can drag the price of the asset below $88. Litecoin continued to depict extreme bullishness as the price was above the 20-Simple Moving Average line.

This meant that buyers were driving the price momentum in the market. The coin was also above the 50-SMA and 200-SMA lines. However, the 50-SMA was above the 20-SMA, which is a sign of impending bearishness and indicates a price pullback.

Buy signals for the asset started to show a decline, which meant that buyers might start to exit the market over the next few trading sessions.

The Moving Average Convergence Divergence (MACD) indicates price momentum and reversal; it displayed receding green signal bars, which meant incoming bearish price action.

Bollinger Bands indicate price fluctuation and volatility; the bands were far apart, which implied forthcoming price instability.

Similar to Notcoin - Blum - Airdrops In 2024

origin »

ETH/LINK Price Action Candlestick Set (LINKETHPA) на Currencies.ru

$ 467.1 (+0.48%)
Объем 24H $0
Изменеия 24h: 0.85 %, 7d: 17.53 %
Cегодня L: $453.49 - H: $467.1
Капитализация $0 Rank 3676
Доступно / Всего 0 LINKETHPA

price past litecoin ltc week resistance zone

price past → Результатов: 126


Ethereum May Surge 35% to $200 in Near-Term; What Will Fuel It?

Throughout the past month, the price of Ethereum (ETH) increased from $126 to $140, by more than 11 percent against the U. S. dollar. Similar to how several strategists expect the bitcoin price to increase substantially if it breaks the $4,200 resistance level in the near-term, traders foresee Ethereum rising to as high as $200 if it rebounds over crucial levels.

2019-3-31 13:29


Фото:

Bitcoin Price Analysis: Upward Drift Continues Following Established Macro Support

Since mid-February, the bitcoin market has continued to drift upward toward a band of strong, macro resistance (shown below as a red band). This slow, drift upward marks our fourth test of the resistance zone and, unlike the three prior tests, our rejection of the level has shown a weakness on the side of the bears:Figure 1: BTC-USD, Daily Candles, Fourth RejectionIf we compare the three prior rejections (labeled 1, 2 and 3), we see that the move into this resistance level was violent — and had equally violent rejections.

2019-3-29 02:21


EOS Price Analysis: Cryptocurrency surges by 14% as EOS gets podium finish on Weiss Ratings

EOS, the fourth largest cryptocurrency on CoinMarketCap was surging for the past few days. This hike can be linked to the release of Weiss Crypto Rating’s annual crypto report. It awarded EOS the second position and an A grade for its promising tech/adoption for long-term investors and an attractive risk/reward for short-term investors.

2019-3-28 18:30


Cardano [ADA] price set to bounce off resistance and head downwards; Here are the important levels to look out for

Cardano, the tenth largest cryptocurrency on CoinMarketCap had a decent rally over the past few days. The price of the cryptocurrency surged by 133% since December 16, 2018. However, the rally seems to be coming to an end as price candles have formed at the end of the ascending channel/rising channel.

2019-3-28 16:45


Newsflash: Bitcoin Price Stumbles Below $4,000; No Fret, A Swift Rebound is Coming

In the past several hours, the bitcoin price slipped below the $4,000 mark from $4,035 to $3,934, recording a 1 percent drop against the U. S. dollar. Given the fact that it took nearly three weeks for bitcoin to break out of the $3,000 region and reach $4,000, the sudden drop in the price of bitcoin below the $4,000 level initially led traders to reconsider the near-term price trend of the dominant cryptocurrency.

2019-3-26 11:50


Фото:

Ravencoin Price: Demand Is Outstripping RVN Supply

Ravencoin (RVN) doesn’t feature much in crypto coverage. Since it launched last January, the asset tokenization platform has largely stayed on the sidelines. With such a low profile, few noticed Ravencoin becoming one of the best performing digital assets over the past month – although an amusing Redditor, SlappyMcFartsack has dubbed the phenomenon ‘The Flappening’.

2019-3-25 21:50


Bitcoin Price: Key Technical Indicator Shows BTC Surging to $5,500

Throughout the past three months, the bitcoin price has flirted with the $4,200 resistance level, often struggling to maintain momentum above the key $4,000 mark. Several traders have demonstrated concerns over the extended period of stability demonstrated by bitcoin because, in late 2018, the cryptocurrency recorded a drop of around 50 percent following three months of stagnation in the $6,300 to $6,500 range.

2019-3-24 21:30


Фото:

Bitcoin Price Analysis: Slow Upward Drift Tests Market Supply

A slow, grinding upward drift has been the name of the game for bitcoin’s market over the last few weeks. The upward drift is bringing us slowly to a level that was previously rejected violently:Figure 1: BTC-USD, Daily Candles, Upward DriftOur third rejection of the red resistance level shown above brought the market into a test of macro support in the mid-$3,000s.

2019-3-23 01:23


Фото:

Op Ed: With Bitcoin, Anarchy Is the Point, Not the Problem

Last week, there was a panel at SXSW that was effectively a debate on the merits of permissioned blockchains versus permissionless systems like Bitcoin. I listened to the entire audio of the panel discussion, after Programming Bitcoin author Jimmy Song tweeted it out the other day, and I thought he did an awesome job of pointing out the key value proposition of Bitcoin and why it is not worth comparing to permissioned systems.

2019-3-23 17:29