2021-5-22 18:35 |
The Bitcoin (BTC) price has decreased considerably since reaching an all-time high price on April 14.
This is the second major correction since breaking the previous all-time high. In 2017, there were four corrections after the all-time high breakout.
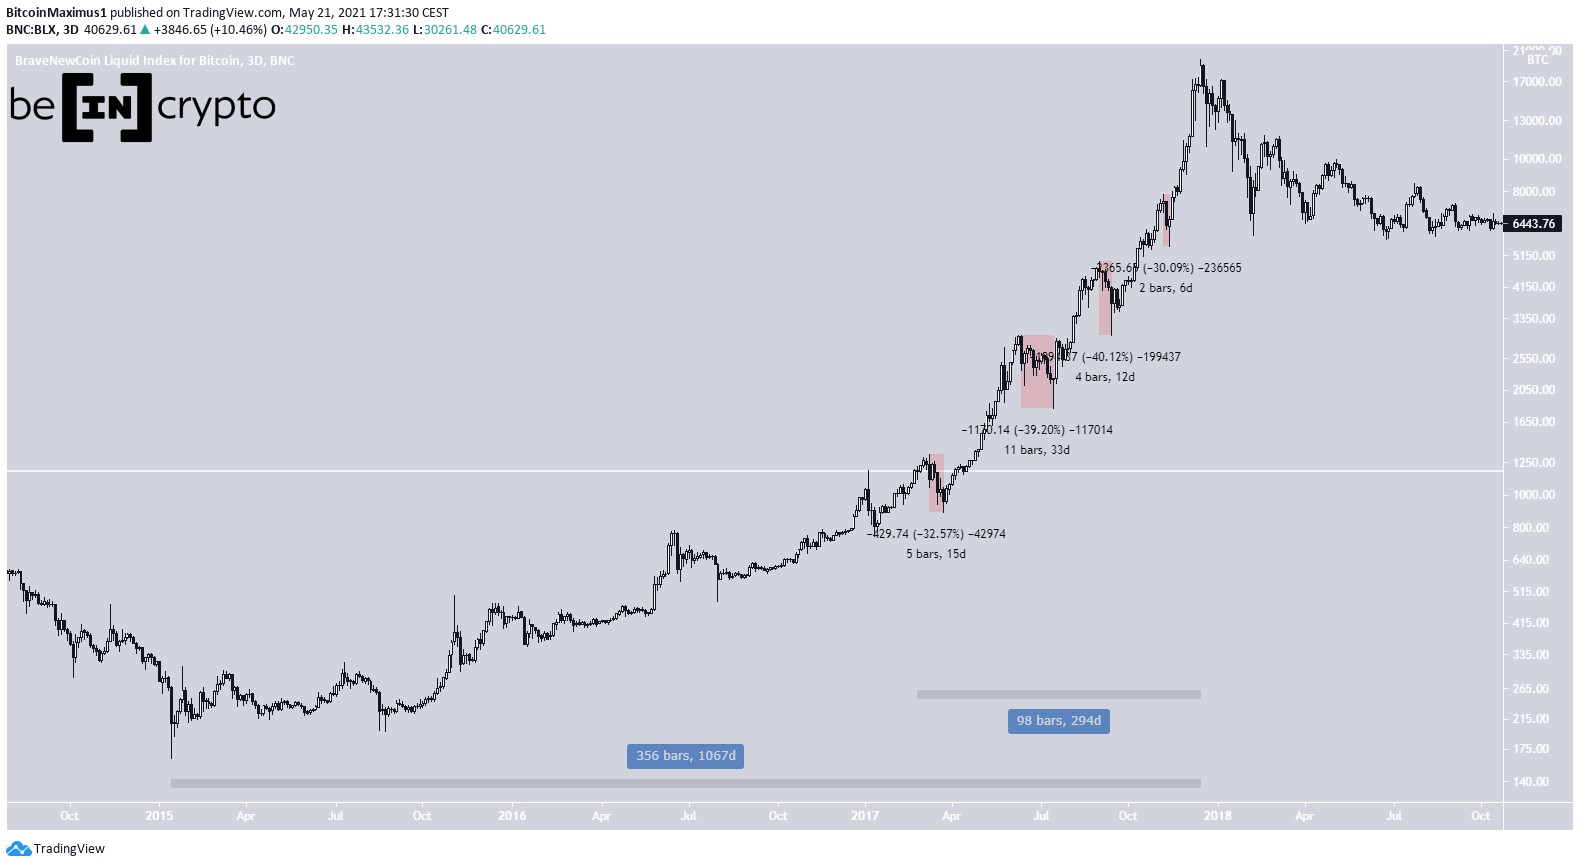
2017 BTC correctionWe will only measure correction larger than 20%, occurring after the previous all-time high of $1177 was broken (white horizontal line) The all-time high was broken on Feb. 27, 2017.
The first correction began on March 10. It lasted for 15 days and the price decreased by 32.57%. The second correction began on June 12. It lasted for 34 days and the price decreased by 39.20%. The third correction began on Sept. 2. It lasted for 13 days and the price decreased by 39.54%The fourth and final BTC correction was more of a flash crash. It lasted for only four days, however the price decreased by 30%. Afterwards, it continued to increase until it reached a then all-time high of $19,764 on Dec. 17, 2017.
All in all, the corrections lasted between 13-34 days (excluding the flash crash) and had a magnitude between 32.57-39.54%.
From the 2015 low, the entire upward movement lasted for 1067 days. The portion after the all-time high measures 294 days.
Chart By TradingView Current movementSo far, there have been only two corrections since breaking the previous all-time high (horizontal white line).
The first one began on Jan. 8. It continued for 14 days, in which BTC lost 31.30% of its value.
The second one began on April 14. If yesterday was the low, it continued for 35 days, measuring 54.31%. Therefore, it is the sharpest correction to date.
The corrections in the current bull run have lasted between 14 and 35 days, measuring between 31.30-54.31%.
Interestingly, the corrections in the 2017 run lasted between 13 and 34 days.
The entire bullish trend measuring from the Dec. 2018 bottom has lasted for 887 days. The portion since the all-time high measures 153 days.
However, if we were to assume that the $64,840 high on April 14 was the end of the trend, those numbers fall to 854 and 120 days, respectively. The portion of the movement after the all-time high is 2.45 times shorter than that in the 2017 movement.
Chart By TradingViewFor BeInCrypto’s latest bitcoin (BTC) analysis, click here.
The post Comparing Bitcoin’s (BTC) May 19 Correction to Those In 2017 appeared first on BeInCrypto.
origin »Bitcoin price in Telegram @btc_price_every_hour
Bitcoin (BTC) на Currencies.ru
|
|


