2020-7-30 11:45 |
On July 30, Bitcoin (BTC) seemingly began another rally but was stopped before reaching the previous high, creating a long upper-wick in the process.
The price has broken down from a short-term ascending support line and looks to be heading towards the closest support areas.
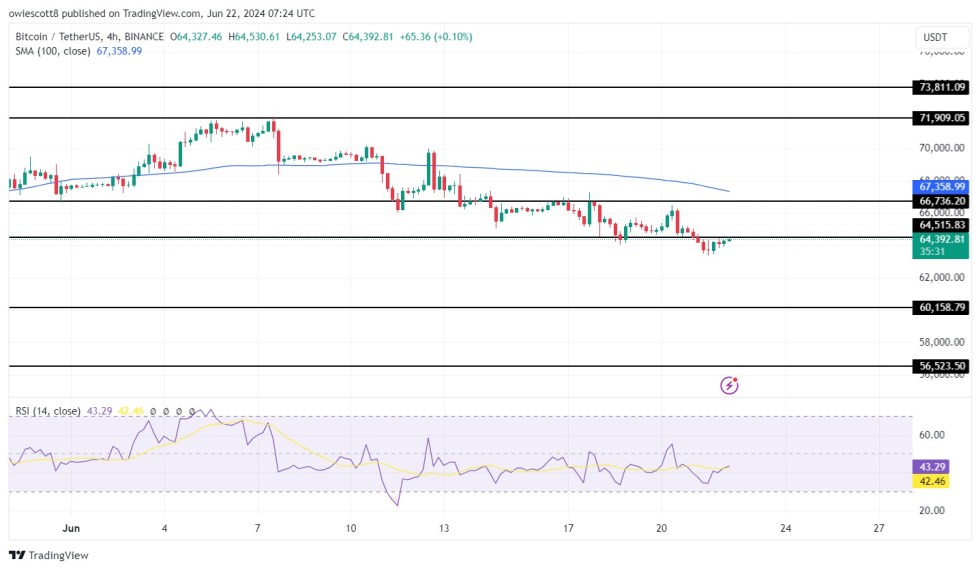
Bitcoin Evening Star Confirms WeaknessThe Bitcoin price reached a high of $11,394 on July 27. After a brief pause, the price began another upward move yesterday. However, it only reached a high of $11,342 before decreasing once more. This movement has left several long upper-wicks in place, a sign of selling pressure.
Furthermore, the most recent three 12-hour candlesticks are in the process of creating an evening star pattern, which would be completed with a close below $10,900.
Technical indicators are showing that the upward movement has lost momentum. The MACD has begun to decrease, and the RSI has generated bearish divergence inside the overbought area. These are signs that the price will likely decrease and strengthen the possibility of an evening star being completed.
BTC Chart by TradingviewThe hourly chart shows that the price has already broken down from an ascending support line. At the time of press, BTC was trading above the 50-hour moving average (MA) which has been providing support since the upward movement began.
If the price breaks down, the next significant support area would be found at $10,700. The primary support area would be found at $10,300 which is also bolstered by the 200-hour MA.
BTC Chart by Tradingview Wave CountAssuming that BTC is in the process of retracing, the long-term wave count suggests that the price is currently in wave 4 (black), which could transpire inside an a-b-c correction (green). The correction has potentially just begun, so it is too early to try and define the pattern.
The 0.5 Fib level of the entire upward move is found near $10,189, making this a likely level for the correction to end.
The upward move lasted for 11 days, and the correction is currently only in its second day. After the correction is completed, BTC would be expected to increase towards a higher-high to complete wave 5.
BTC Chart by TradingviewIn the short-term, we can see that this is a flat A-B-C correction (red), and the price is currently in the C wave. If we draw a parallel channel connecting the recent highs, we get a low of $10,500 for the bottom of C.
This would be only slightly below the A wave bottom and at the 0.382 Fib level of the short-term wave 5 (green).
The entire 0.382-0.5 Fib level of the move between $10,326-$10,578 is a very likely level for a reversal.
BTC Chart by TradingviewTo conclude, the Bitcoin price has seemingly begun a short-term retracement that is expected to end near $10,500.
For our previous analysis, click here.
The post Bitcoin Falls After Failing To Create a Higher-High appeared first on BeInCrypto.
origin »Bitcoin price in Telegram @btc_price_every_hour
Bitcoin (BTC) на Currencies.ru
|
|