2021-2-17 13:43 |
The Bitcoin Dominance Rate (BTCD) has been decreasing since the beginning of the year and is approaching a crucial support level at 58%.
While the Bitcoin Dominance Rate seems to be bouncing in the short-term, it is expected to eventually fall and gradually decrease towards support levels.
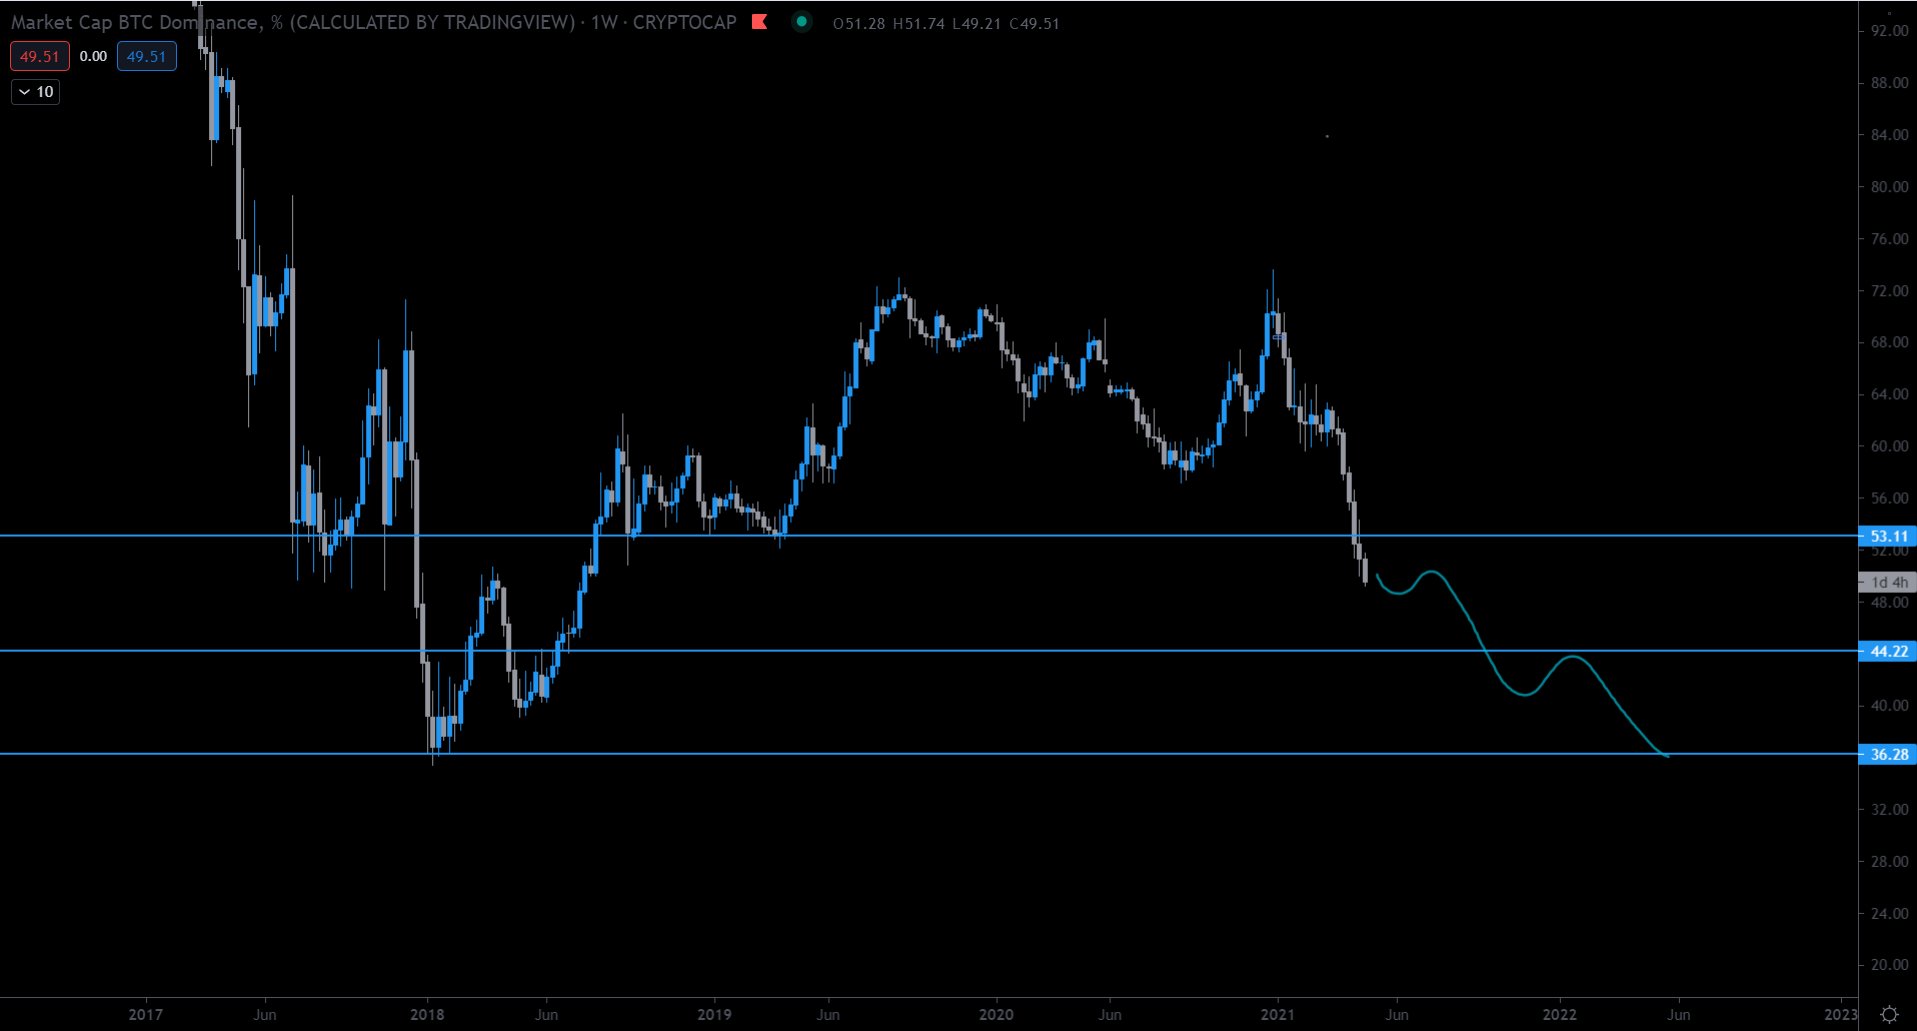
Long-Term Bitcoin Dominance LevelsThe weekly chart shows that the Bitcoin Dominance Rate has been moving downwards since reaching the 71.5% resistance area in January 2021. The BTCD has not traded above this level since 2017.
The closest support area is found at 58%, and the next below that is between 52%-54%.
Technical indicators are bearish. The MACD, Stochastic oscillator, and RSI are decreasing — the latter crossing below the 50-line.
A MACD cross into negative territory and a bearish cross in the Stochastic oscillator would confirm that the trend is bearish.
BTCD Chart By TradingViewCryptocurrency trader @TheEuroSniper outlined a BTCD chart, stating that dominance could decrease all the way down to 54%. However, he believes a short-term upward movement will occur prior to the breakdown.
Source: TwitterWhile the long-term trend looks bearish, supporting the possibility that the BTCD will decrease towards 52-54%, we need to take a look at the daily time-frame in order to determine if it will bounce prior to breaking down.
Current MovementThe daily chart provides a more bullish outlook.
Despite the ongoing decrease, technical indicators are bullish. The Stochastic oscillator has made a bullish cross (green arrow) and the RSI has generated a considerable bearish divergence. However, it seems likely that the RSI will eventually generate a hidden bearish divergence, invalidating the previous bullish one.
Furthermore, the RSI is still below the 50-line and the MACD has not crossed into positive territory.
Therefore, the most likely scenario has BTCD bouncing towards the 65% resistance area (0.382 Fib retracement level) and resume its downward movement after.
BTCD Chart By TradingViewThe two-hour chart supports this possibility.
Both the MACD and RSI are bullish, but the latter has just reached overbought levels. The three previous times it did this, a significant decrease ensued.
Furthermore, the BTCD is potentially following a descending resistance line, though it has yet to be validated.
If BTCD gets rejected by this resistance, it would be expected to fall towards 58% and potentially lower.
If not, it could resume its upward movement towards 65% before eventually breaking down.
BTCD Chart By TradingView Relationship to BTCThroughout February, the BTCD and Bitcoin (BTC) price have had a positive correlation. This means that an increase in the price of BTC causes an increase in BTCD.
While the correlation has not been perfect, since the coefficient (black line) has been below 1 the majority of the time, it remains strong.
Nevertheless, as long as this relationship holds, a BTC price decrease would be required for the BTCD to fall.
BTCD Chart By TradingView ConclusionThe Bitcoin Dominance Rate is expected to bounce towards 65% before eventually resuming its downward movement towards the support at 54%.
For BeInCrypto’s latest Bitcoin (BTC) analysis, click here
The post Bitcoin Dominance Comes to Life After Prolonged Decrease appeared first on BeInCrypto.
origin »Bitcoin price in Telegram @btc_price_every_hour
Bitfinex Bitcoin Dominance Perps (BTCDOM) на Currencies.ru
|
|