2020-9-21 10:35 |
The Bitcoin (BTC) price has continued its ascent after bouncing at a long-term support level.
Due to the length and magnitude of the increase, it is now likely that BTC has begun a new upward movement.
Bitcoin Bounces at Long-Term SupportDuring the week of Sept 14-21, the Bitcoin price continued its ascent from the previous week in which the price bounced at the $10,000 level and created a Doji candlestick.
Last week the price created a bullish candlestick but failed to reach the primary support and resistance level seen throughout much of August and September.
Technical indicators are relatively neutral. Both the RSI and Stochastic Oscillator are above 50 and increasing, but the MACD has decreased for the third consecutive week.
BTC Chart By TradingView Has a Reversal Begun?The daily chart shows that the aforementioned increase ended at the 0.618 Fib level of the entire downward move at $11,214. However, the rejection was not strong, and BTC seems to be gearing up for another attempt at breaking out.
If successful in breaking out, it’s possible that the price would find resistance near $11,400, just below the descending resistance line connecting the two most recent lower-highs.
BTC Chart By TradingViewTechnical indicators on the daily time-frame are bullish. The RSI has clearly moved above 50 and validated the line as support. The Stochastic Oscillator is in the process of making a bullish cross, and the MACD is also moving upwards, having almost crossed into positive territory.
BTC Chart By TradingViewThe shorter-term two-hour chart is also bullish. The price has just bounced at an ascending support line and is moving upwards. Similar to the daily time-frame, technical indicators are also bullish.
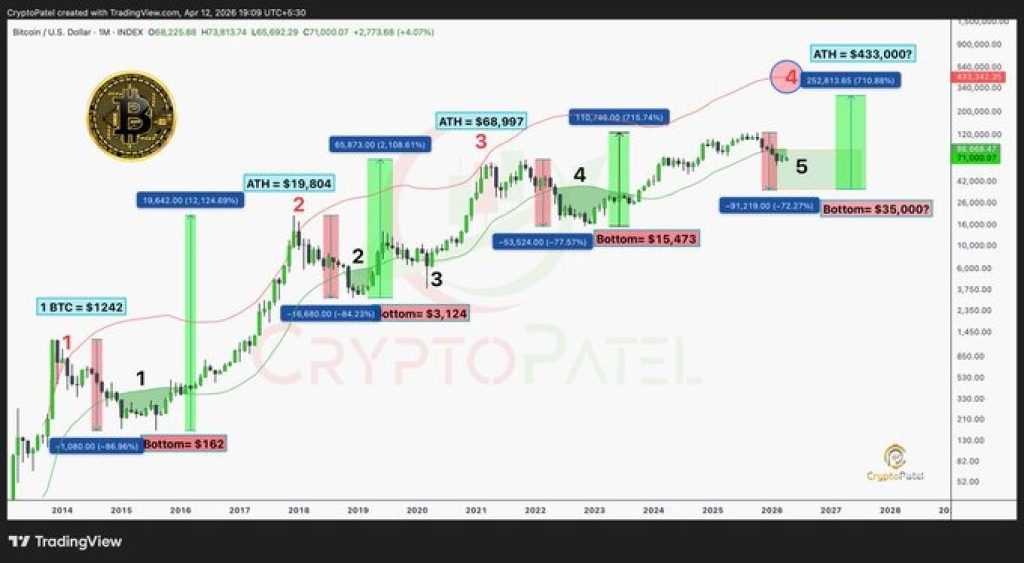
BTC Chart By TradingView Wave CountsThe long-term Bitcoin wave count suggests that the price has completed wave 4 (in black below), and has now begun a new bullish impulse.
The price has respected the 0-2 trendline, which is customary in such impulses. A decrease below the wave 1 high at $9,451 would invalidate this particular wave count.
Last week’s increase breached the previous $11,163 low (dotted red line) invalidated the majority of bearish wave counts.
BTC Chart By TradingViewIf the price completed its correction on Sept 9, then it has likely in wave 5 (in orange below) and has just begun a new upward movement following an ascending support line.
A possible target for the top of this wave would be at $11,350, a previous resistance area. In addition, if the price were to reach this high, waves 5 and 1 would have a 1:1 ratio, which is customary when wave 3 is extended.
BTC Chart By TradingViewTo conclude, it is likely that BTC has begun a new upward move that will eventually take it towards a new yearly high.
For BeInCrypto’s previous Bitcoin analysis, click here!
The post Bitcoin Continues Ascent Towards $11,000 Following Weekend Rejection appeared first on BeInCrypto.
origin »Bitcoin price in Telegram @btc_price_every_hour
Bitcoin (BTC) на Currencies.ru
|
|