2021-9-1 14:02 |
Bitcoin (BTC) initiated an upward move on Aug 31 and reached a high of $48,246. However, it failed to sustain the rally and created a long upper wick.
While the daily chart shows signs of weakness, there are bullish signs in lower time frames that indicate a short-term breakout is expected.
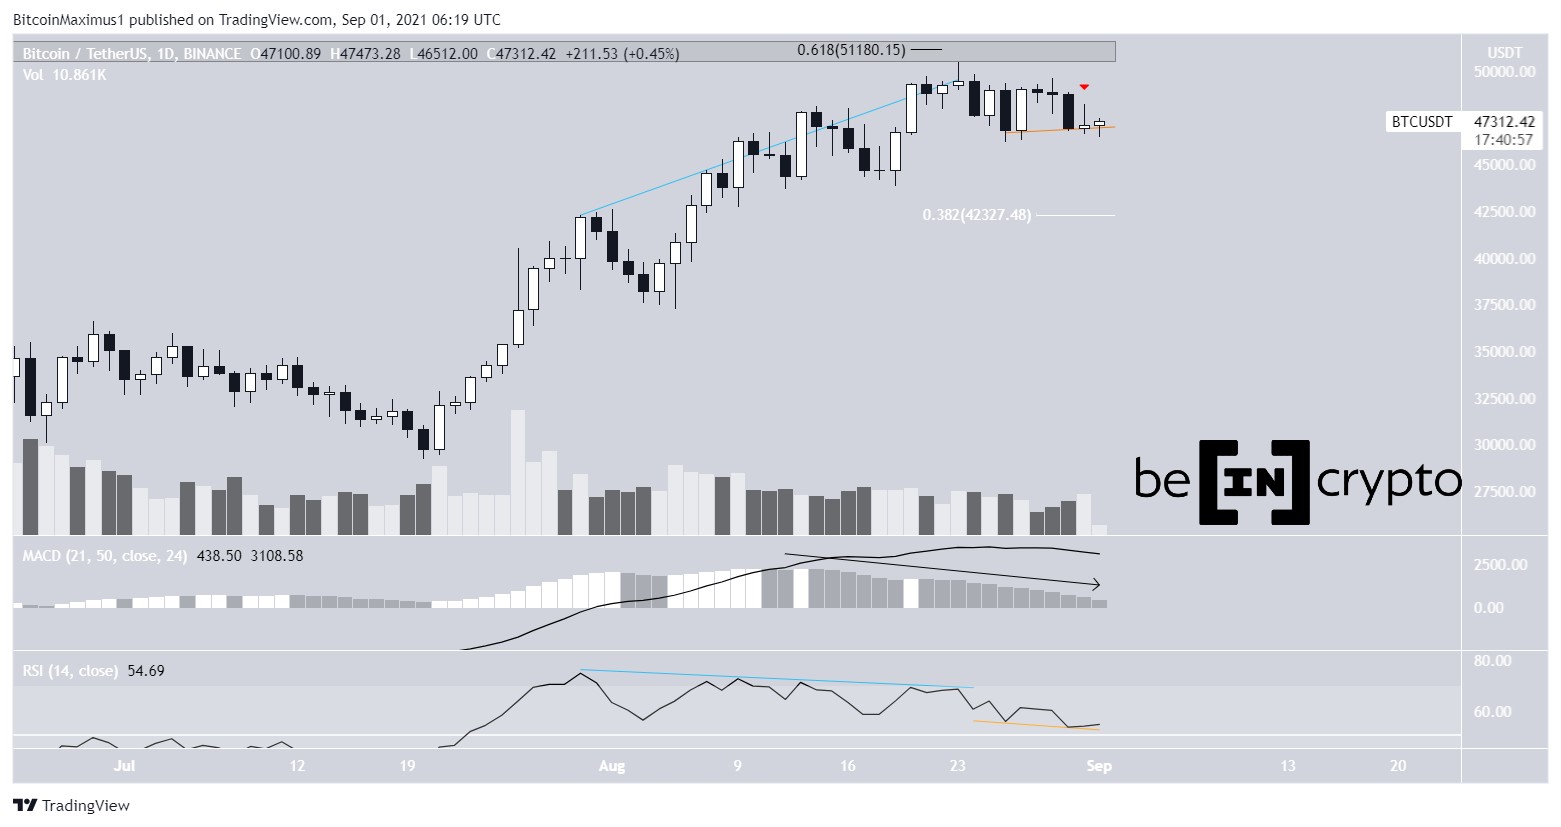
Daily BTC movementBTC reached a close yesterday just incrementally above the opening price.
With the exception of a hidden bullish divergence (orange) that would be invalidated with a bearish close, technical indicators are bearish.
The MACD and RSI have both generated bearish divergences prior to the drop. Furthermore, the MACD is close to turning negative and the RSI is close to moving below 50.
The next closest support is at $42,400.
BTC Chart By TradingView Failed breakdownThe six-hour chart provides a more mixed reading. BTC has broken down from an ascending support line. However, it did not initiate a significant downward move and has been hovering close to the breakdown level (red circle).
Technical indicators are still clearly bearish. The MACD is negative and the RSI is below 50.
BTC Chart By TradingViewThe two-hour chart, however, indicates that a breakout is likely.
The price is trading inside a descending parallel channel. This pattern often contains corrective structures.
BTC has bounced at the $46,800 support area after sweeping the lows and the MACD is turning bullish.
Therefore, while the direction of the long-term move still seems to be bearish, a breakout from this channel seems to be the most likely option.
BTC Chart By TradingView Future movementThe long-term wave count remains unclear since both the bearish (red) and bullish (orange) possibilities are still valid.
However, the failure of the price to immediately drop suggests that the bullish count is more likely.
BTC Chart By TradingViewNevertheless, this does not negate the possibility that BTC will eventually drop to $42,400. However, a breakout that would complete the B sub-wave seems to be the more likely scenario.
The other possibility indicates that this is a fourth wave triangle and BTC will break out after some more consolidation.
BTC Chart By TradingViewFor BeInCrypto’s previous Bitcoin (BTC) analysis, click here.
The post Bitcoin (BTC) Holds on to Hope Above Minor Support appeared first on BeInCrypto.
origin »Bitcoin price in Telegram @btc_price_every_hour
Bitcoin (BTC) на Currencies.ru
|
|


