2021-9-23 10:27 |
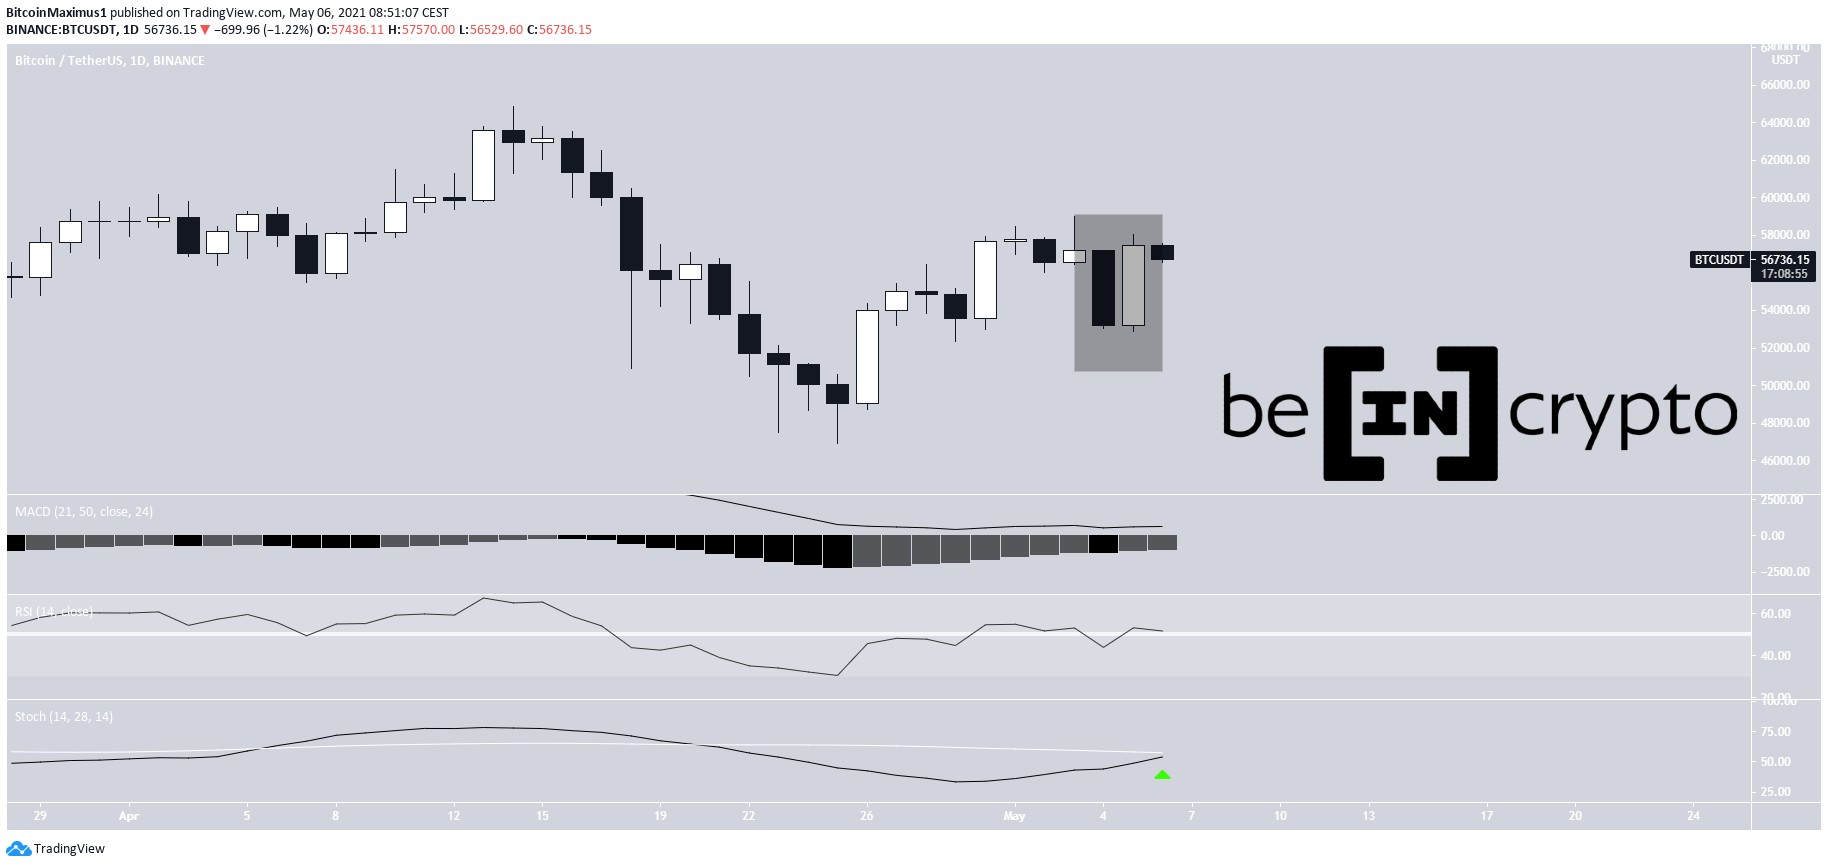
Bitcoin (BTC) bounced considerably on Sept 22, creating a bullish engulfing candlestick in the process.
While BTC is currently trading close to short-term resistance, it’s likely that the low has been reached.
Ongoing BTC bounceBTC increased considerably on Sept 22, creating a bullish engulfing candlestick in the process.
The bounce also validated the $40,820 area as support. This is the 0.5 fib retracement support level.
Currently, it’s facing resistance at $44,000. This same area previously acted as support.
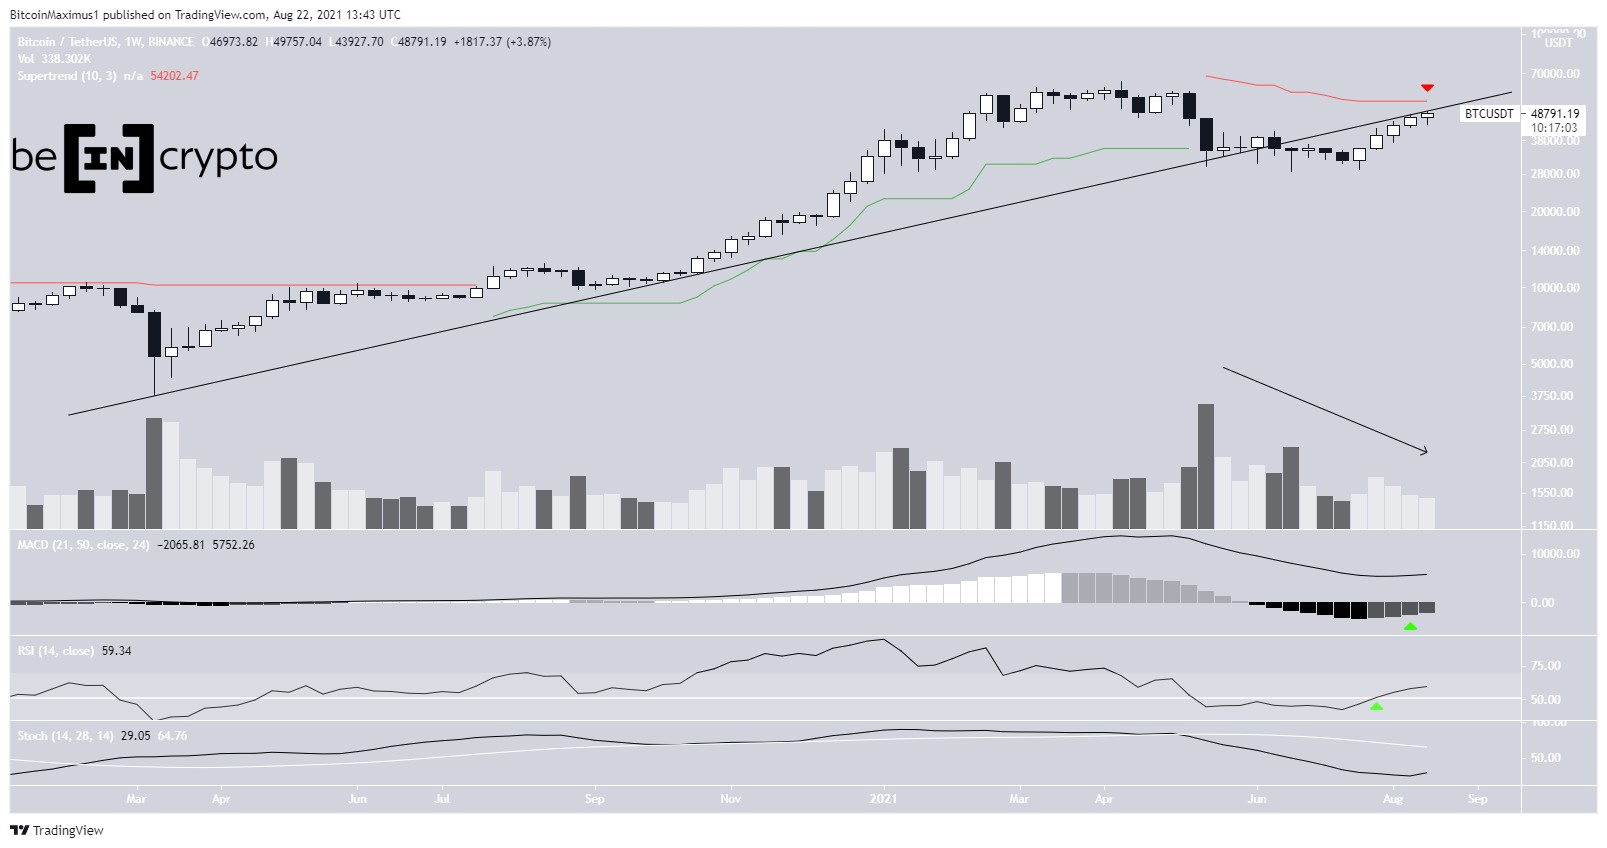
Despite the strong bounce and creation of a bullish candlestick, technical indicators for BTC are still bearish. The RSI is below 50, the MACD is decreasing, and the Supertrend line is bearish.
The next closest support area is found at $38,000. This is the 0.618 Fib retracement support level and a horizontal support area.
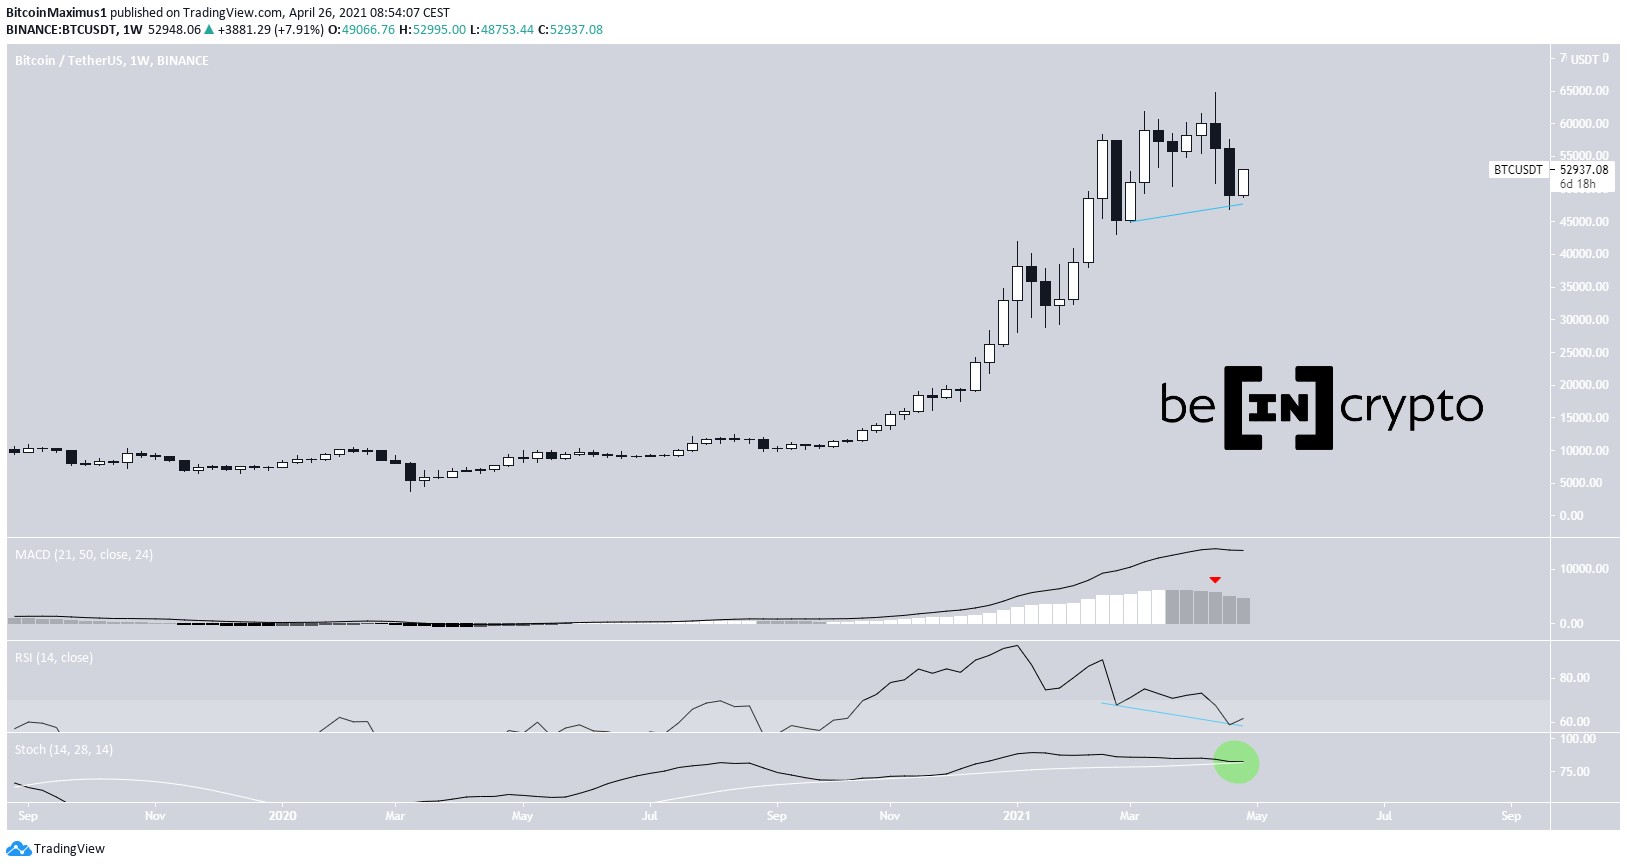
BTC Chart By TradingView Future movementThe six-hour chart shows a descending parallel channel in place. Such channels usually contain corrective structures.
On Sept 21, BTC reached the support line of the channel and bounced. It’s currently in the middle of the channel, which coincides with the $44,250 resistance area (0.5 Fib retracement resistance level).
While the MACD and RSI are showing bullish signs, neither has confirmed the bullish reversal. BTC has to reclaim the midline of the channel and validate it as support in order to confirm the possibility of a breakout.
BTC Chart By TradingView Wave countThe most likely wave count suggests that the completed BTC decrease was part of an A-B-C corrective structure (orange).
The aforementioned Sept 21 low was made very close to the $38,750 level created by giving waves A:C a 1:1 ratio.
Furthermore, there is a completed five-wave bearish impulse (black) in the sub-wave structure.
Chart By TradingViewThe minute chart shows that the movement is developing into a wedge-shaped formation, which means that it could be a leading diagonal.
Therefore, the most likely move would be a breakdown from the wedge, the creation of a higher low, and upwards continuation after that.
BTC Chart By TradingViewFor BeInCrypto’s previous Bitcoin (BTC) analysis, click here.
The post Bitcoin (BTC) Creates Bullish Candlestick After Considerable Bounce appeared first on BeInCrypto.
origin »Bitcoin price in Telegram @btc_price_every_hour
ETH/LINK Price Action Candlestick Set (LINKETHPA) на Currencies.ru
|
|