2020-4-24 21:26 |
On April 23, the Bitcoin price increased considerably and created the second successive bullish candlestick. The price reached a high of $7,738 before decreasing slightly.
The aforementioned high is the highest price BTC has reached since the rapid decrease on March 12. In addition, it is only 3% below the price on that day, meaning that BTC has recouped almost all of the losses stemming from the crash.
In this article, we will take a look at the price movement for 10 cryptocurrencies and analyze their future outlook.
Bitcoin (BTC)Using the hourly chart, we can see that the aforementioned breakout occurred with tremendous volume, increasing its validity.
Since then, the price has created a symmetrical triangle, which is considered a neutral pattern. However, since it is occurring after an upward move, it is likely to act as a continuation pattern and cause the price to break out.
If the price breaks out, it is likely to reach the closest resistance area, which is found at $8,050 and also coincides with the ascending resistance line from the channel. A breakdown below the ascending support line would invalidate this possibility.
Bitcoin Chart By Trading View Ethereum (ETH)The Ethereum price is trading inside an ascending wedge and has been doing so since reaching a bottom on March 13. Both the resistance and support lines have been validated numerous times, and the price is approaching the end of the ascending wedge.
Since the wedge is considered a bearish pattern, a breakdown from the pattern would be expected. If so, the likeliest level for the rally to end would be at $205, which is both the closest resistance area and the resistance line of the ascending wedge. This possibility is supported by the developing bearish divergence in the RSI.
If the price breaks down, the closest support level is found at $154.
Ethereum Chart By Trading View XRP (XRP)The XRP price is possibly trading inside an ascending, broadening wedge and has been doing so for the past three days. This type of wedge is considered a bearish reversal pattern. Inside this wedge, the price has created a very short-term double top that has been combined with bearish divergence in the RSI. Afterward, the price began a downward move that is still ongoing.
The price is likely to continue this downward move until it reaches the support line of the wedge, where it could bounce upwards.
The closest resistance area is found at $0.202. It would make sense for the price to reach it, before eventually breaking down.
XRP Chart By Trading View Bitcoin Cash (BCH)The BCH price is following an ascending support line with a very gradual slope and has been doing so since March 22. The price has validated the ascending support line five times until now.
However, at the time of writing, the price was not close to this ascending support line. Rather, it was trading very close to the $246 resistance area, where it has made a double top. In addition, the double top has been combined with bearish divergence in the RSI. Therefore, it is likely that the price will decrease towards the support line once more.
If a breakout occurs, which does not seem likely at the current time, the closest resistance area can be found at $275.
BCH Chart By Trading View Bitcoin SV (BSV)The BSV price is trading inside a descending triangle and has been doing so since April 9. The descending triangle is considered a bearish reversal pattern. Furthermore, the price was rejected by the $205 resistance area and left a long upper wick in its wake.
This area holds tremendous importance, since it initially acted as resistance during the rapid decrease on March 11. Afterward, the price moved above this area, reaching a high of $226 on April 9, and decreased below it shortly after. This is a bearish sign that suggests the breakout was not valid and the price will move downwards.
If the price breaks down from the descending triangle, which looks likely, the closest support level would be found at $148.
BSV Chart By Trading View Litecoin (LTC)Since April 11, the LTC price has been trading inside a range between $39.5 and $43.5. While it has made small movements above/below this line, the price has returned back inside the range afterwards.
In addition, the price had been following a descending resistance line since April 7. On April 23, the price broke out above this descending resistance line and followed it up with a breakout from the aforementioned range the next day.
Therefore, the price is expected to continue moving upwards until it reaches the closest resistance area, which is found at $47.
LTC Chart By Trading View Binance Coin (BNB)The BNB price is trading inside a short-term ascending channel and has been doing so since April 7. Both the resistance and support lines have been validated numerous times.
On April 21, the price touched the ascending support line and began an upward move that is still ongoing. The next day, the price broke out above a very short-term descending resistance line and reached a high of $17.1, before decreasing slightly.
Since there is no bearish divergence in the RSI, the price is expected to continue moving upwards towards the resistance area at $16.8 and possibly the resistance line of the channel.
BNB Chart By Trading View EOS (EOS)The EOS price has been following a long-term ascending support line since March 13, having validated it numerous times, most recently on April 20. Since then, the price has accelerated its rate of increase.
At the time of writing, the price was trading inside the closest resistance area, which is found at $2.75. Inside it, EOS has created a double top, which is considered a bearish reversal pattern. In addition, this pattern is combined with bearish divergence in the RSI, a sign that the price will decrease.
If it does so, it is likely to touch the ascending support line once more.
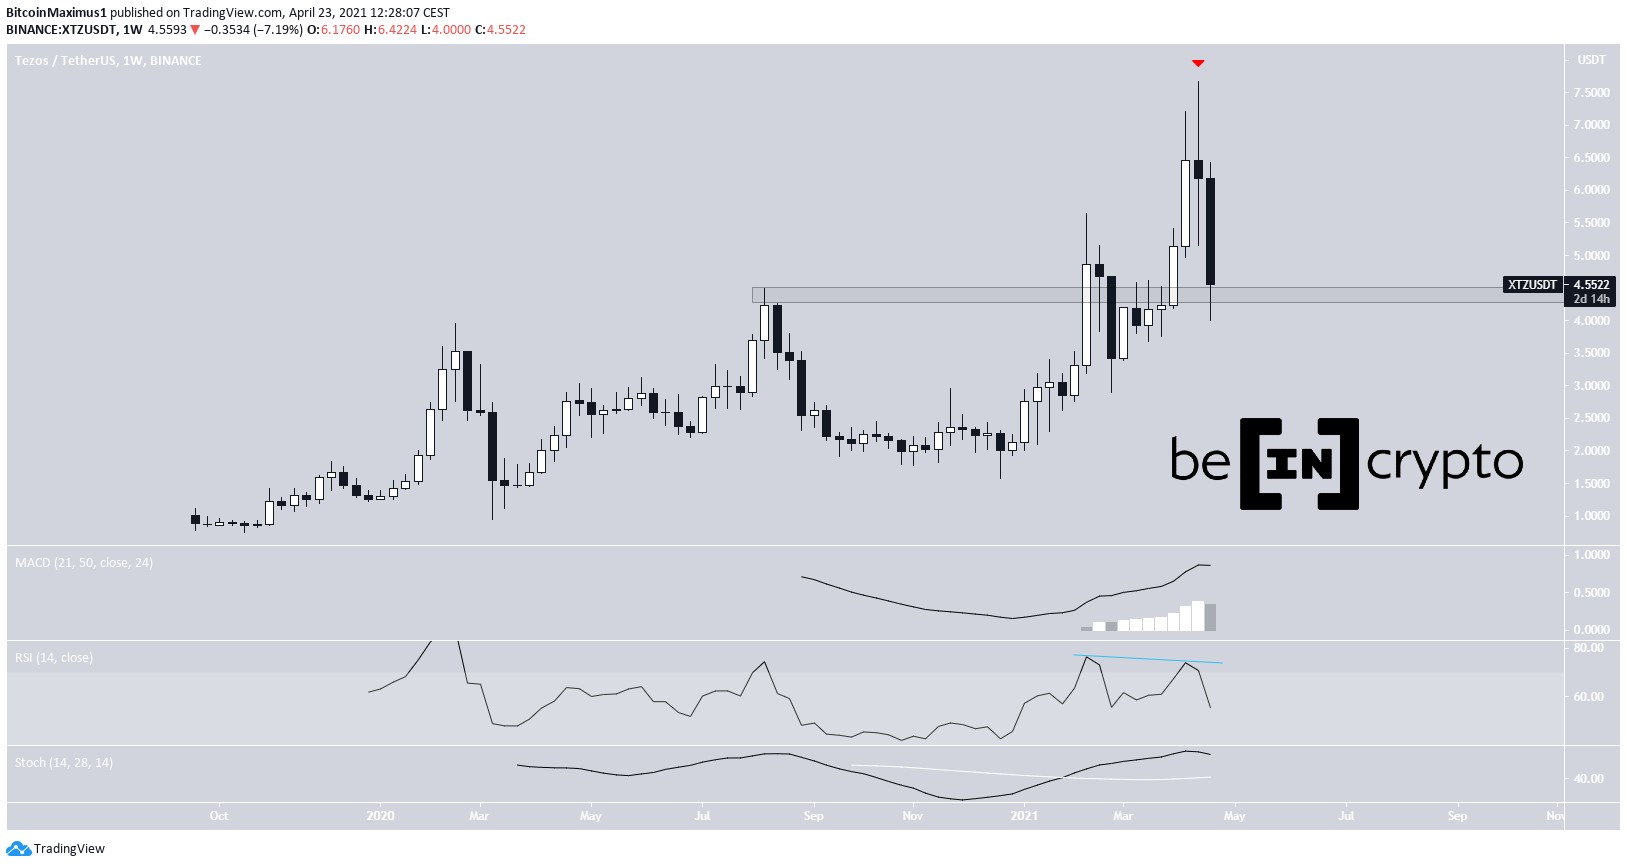
EOS Chart By Trading View Tezos (XTZ)The price has been following an ascending support line since reaching a bottom on March 13. It touched this line for the final time on April 20 and began an upward move that is still ongoing. In addition, on April 22, the price broke out from a descending resistance line that had been in place since Feb. 19.
Since then, the price is in the process of creating the third bullish engulfing candlestick in a row. At the time of writing, it was trading right at the $2.75 resistance area. Since the price has yet to show any weakness, and the RSI has not generated any bearish divergence, XTZ is likely to continue increasing and possibly reach the next resistance area found at $3.3.
XTZ Chart By Trading View Chainlink (LINK)The LINK price is trading inside an ascending wedge and has been doing so since April 7. In addition, it is following a longer-term ascending support line since March 13.
The price is approaching the projected end of the wedge and at the time of writing was trading very close to the resistance line of this wedge. Besides being considered a bearish reversal pattern, the RSI has generated considerable bearish divergence. This suggests that the price is likely to decrease and possibly break down.
LINK Chart By Trading ViewIf it does so, it is expected to reach the aforementioned long-term ascending support line.
The post Crypto Price Analysis April 24: BTC, ETH, XRP, BCH, BSV, LTC, BNB, EOS, XTZ, LINK appeared first on BeInCrypto.
origin »Bitcoin price in Telegram @btc_price_every_hour
Bitcoin (BTC) на Currencies.ru
|
|