2021-12-1 11:46 |
Bitcoin (BTC) is currently attempting to break out from both a horizontal and diagonal resistance level. Doing so would confirm that the correction is complete.
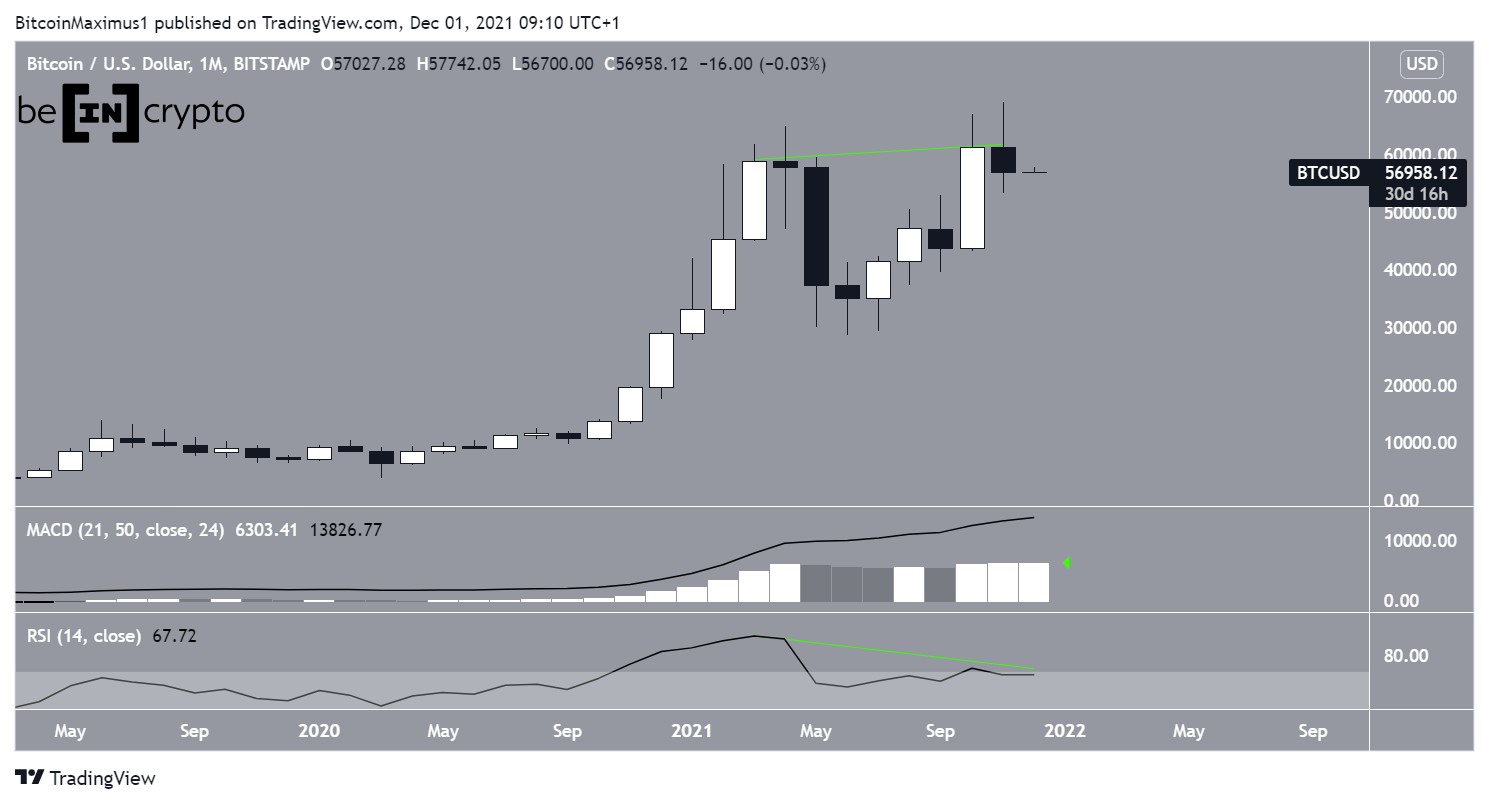
Despite reaching a new all-time high price of $69,000 on Nov 10, BTC completed the month of November with a slight decrease. The closing price of $56,974 was more than $4,500 less than the opening one.
Furthermore, technical indicators provide a mixed outlook.
The MACD, which is created by short and long-term moving averages (MA), is moving upwards and is positive. This means that the short-term MA is increasing at a faster rate than the long-term average. This is a healthy sign in bullish trends.
However, the RSI, which is a momentum indicator, has generated a bearish divergence (green line). This is a bearish sign that often precedes bearish trend reversals.
BTC Chart By TradingView Short-term BTC resistanceThe six-hour chart shows that BTC has been following under a descending resistance line since the aforementioned Nov 10 all-time high price.
The line also coincides with the $39,350 resistance, which is both a horizontal resistance area and the 0.382 Fib retracement resistance level (white). This horizontal resistance already rejected the price, pushing it back under the descending resistance.
A breakout above these levels would confirm that the short-term correction is complete, allowing BTC to potentially move toward new highs.
BTC Chart By TradingViewIn the 30-minute chart, BTC has bounced at the $56,200 horizontal support area. This is also the 0.5 Fib retracement support level when measuring the most recent portion of the upward move.
Below it, there is virtually no support until the $53,245 lows of Nov 28.
Therefore, since the long-term count and readings are also bullish, it would be likely for BTC to create a lower high above this area and eventually initiate an upward move toward new highs.
BTC Chart By TradingViewFor BeInCrypto’s previous Bitcoin (BTC) analysis, click here.
The post Bitcoin (BTC) Closes Monthly Candlestick with Slight Dip Below $57,000 appeared first on BeInCrypto.
origin »Bitcoin price in Telegram @btc_price_every_hour
Bitcoin (BTC) на Currencies.ru
|
|


