2022-5-31 11:00 |
After breaking out from a short-term consolidation pattern, bitcoin (BTC) reached a high of $32,222, its highest price since May 10.
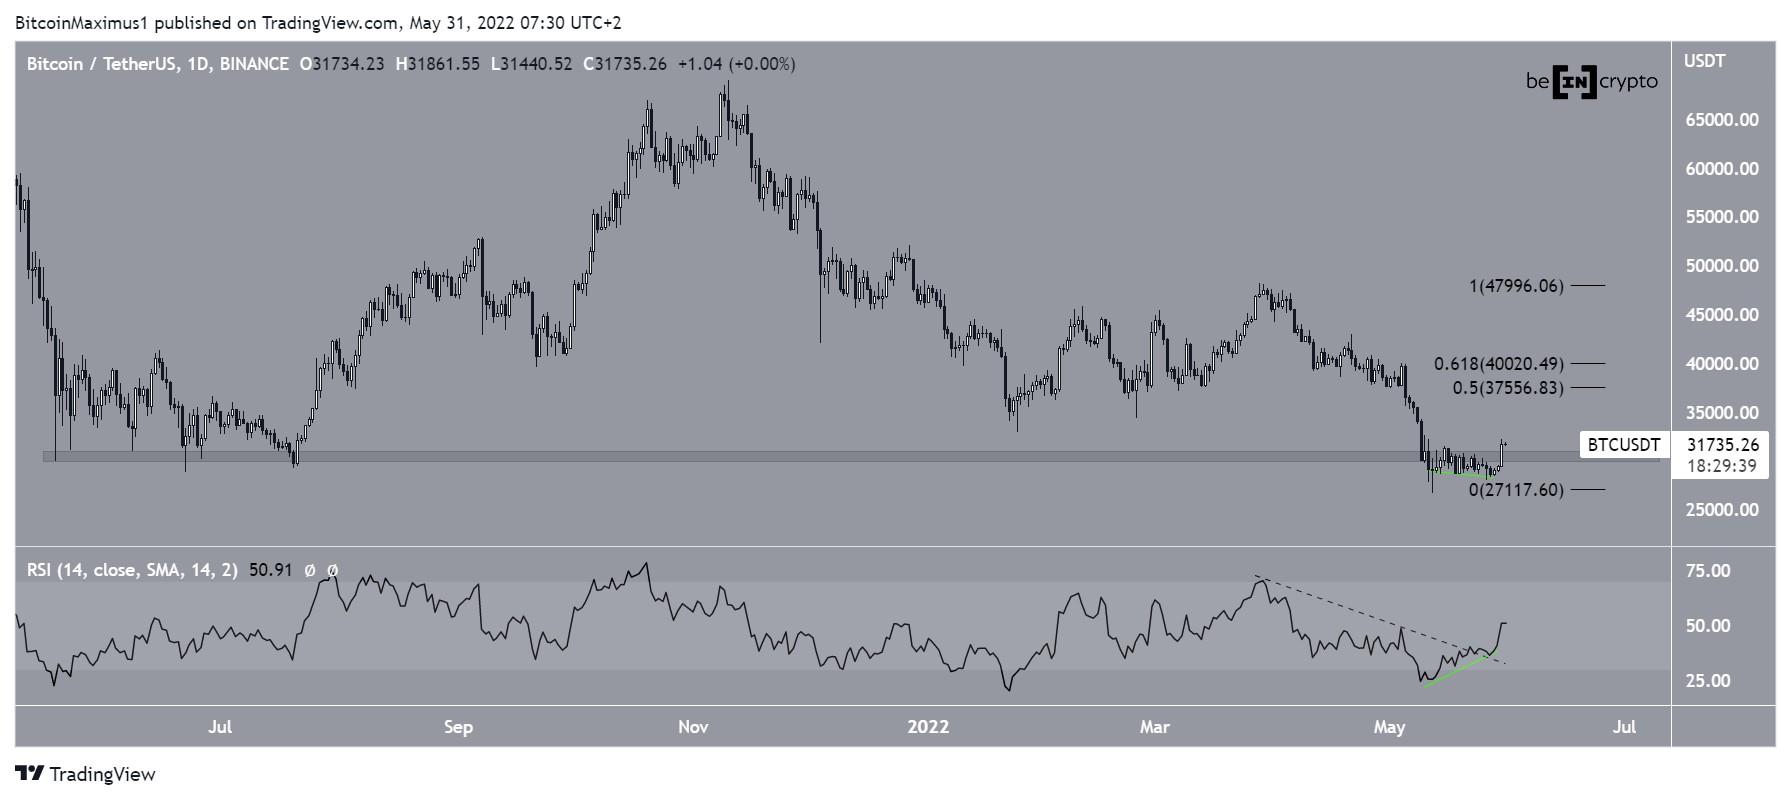
BTC has been moving upwards since reaching a low of $26,700 on May 12. So far, the increase has led to a high of $32,222 on May 30.
The upward movement was preceded by a bullish divergence in the daily RSI (green line). Additionally, the RSI broke out from a bearish trendline (dashed) prior to this increase.
More importantly, the price has now reclaimed the $30,500 horizontal area. The area had been acting as support since May 2021, prior to the May 2022 breakdown. If it manages to validate it as support, it would mean that the supposed breakdown was only a deviation.
In case upward movement continues, the closest resistance levels would be between $37,500 and $40,000. These are the 0.5-0.618 Fib retracement resistance levels.
BTC/USDT Chart By TradingView Channel breakoutThe two-hour chart shows that prior to the May 30 breakout, BTC had been trading inside a descending parallel channel since May 16. Such channels usually contain corrective movements, meaning that a breakout from them is likely.
The two-hour RSI is overbought, suggesting that the short-term movement is overextended. However, there is no bearish divergence in place, which would indicate that a drop is likely.
BTC/USDT Chart By TradingView BTC wave count analysisThere are two main possibilities for the wave count.
It could be that BTC is in the C wave of an A-B-C corrective structure (black). Giving waves A:C a 1:1 ratio would lead to a high of $34,000. Conversely, giving them a 1:1.61 ratio would lead to a high of $37,600.
BTC/USD Chart By TradingViewAlternatively, if the price is in a bullish wave count instead, it would be in wave three of a five-wave upward movement, which would take it towards $40,000.
The longer-term wave count also suggests that the price might have bottomed.
In any case, a movement towards at least $34,000 seems to be likely.
BTC/USD Chart By TradingViewFor Be[in]Crypto’s latest bitcoin (BTC) analysis, click here
The post Bitcoin (BTC) Briefly Moves Above $32,000 After Crucial Bullish Divergences appeared first on BeInCrypto.
origin »Bitcoin price in Telegram @btc_price_every_hour
Bitcoin (BTC) на Currencies.ru
|
|