2022-6-29 17:30 |
Bitcoin (BTC) has been moving upwards since June 18 and is currently attempting to create a higher low above $21,000.
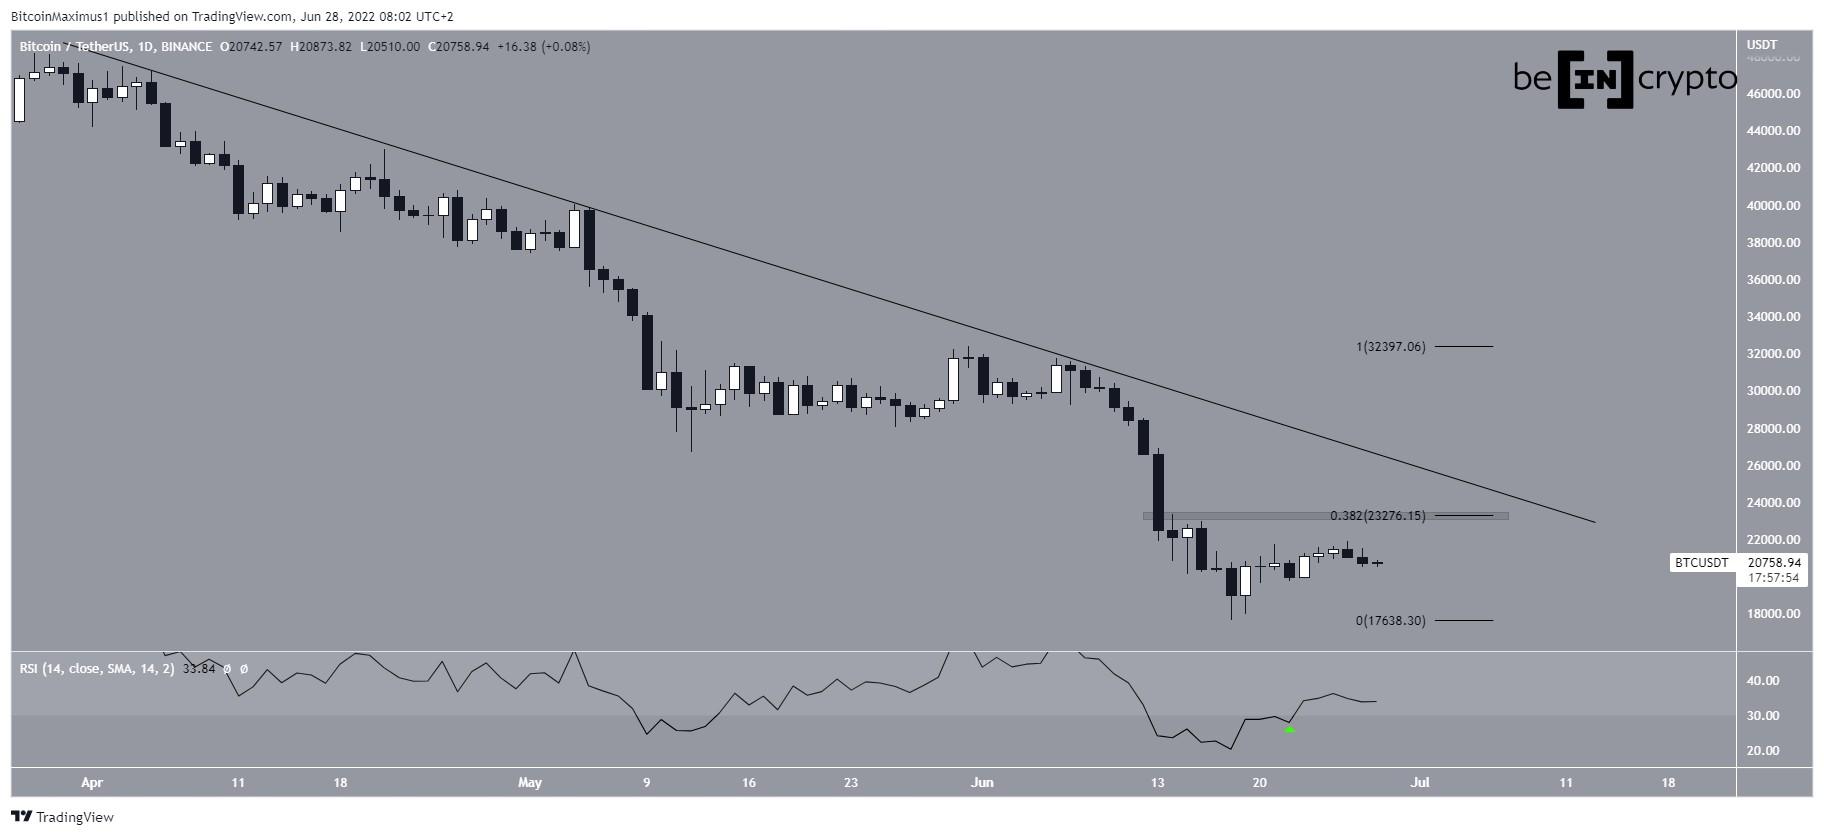
BTC has been falling underneath a descending resistance line since the beginning of April. The line caused a rejection on June 7 and led to a $17,622 low on June 16. The price has been moving upwards since.
The RSI has now moved outside its oversold territory by increasing above 30 (green icon). This is usually a sign that the trend is gradually turning bullish.
If the upward movement continues, the closest resistance area would be at $23,275, created by the 0.382 Fib retracement resistance level, which also coincides with the aforementioned resistance line.
A price breakout above the area and line would be a sign that the trend has turned bullish.
BTC/USDT Chart By TradingView Short-term BTC breakoutThe two-hour chart shows that the price has broken out from a short-term inverse head and shoulders pattern. This is a bullish pattern that often leads to upward movements. So, it supports the continuation of the increase towards the previously outlined resistance.
Currently, the price is in the process of validating the descending resistance line (green icon) as support.
BTC/USDT Chart By TradingViewThe six-hour chart also supports this possibility, due to the fact that the movement below the $20,150 seems like a deviation. The area is now expected to provide support.
If BTC manages to create a higher low, it would pave the way for the continuation of the upward movement. The possibility of this increase transpiring would become greater if the RSI also increases above 50.
BTC/USDT Chart By TradingView Wave count analysisThere are still several possibilities for the long-term wave count. As for the short-term count, the main possibility is that the price has completed a five-wave downward movement since July, and began another one on June 18.
Currently, the price is attempting to complete an A-B-C corrective structure above the 0.382 to 0.5 Fib retracement support level at $19,600 to $20,100.
If it is successful in doing so, it can initiate an upward movement towards the resistance area at $23,275.
BTC/USD Chart By TradingViewFor Be[in]Crypto’s previous bitcoin (BTC) analysis, click here
The post Bitcoin (BTC) Breaks out From Short-Term Bullish Pattern appeared first on BeInCrypto.
origin »Bitcoin price in Telegram @btc_price_every_hour
Bitcoin (BTC) на Currencies.ru
|
|


