Bearish chart pattern suggests Bitcoin could dump to $20k

Bearish chart pattern suggests Bitcoin could dump to $20k
фото показано с : coinjournal.net

2021-1-13 13:11

If the right shoulder in the H&S pattern fails to complete, the continuation of an ascending triangle could suggest a bullish reversal

Bitcoin (BTC) could see a major pullback in the coming weeks if a bearish pattern formed recently validates the negative outlook. Despite its recent rebound to highs of $37,000, the subsequent rejection towards $32,000 seen in the past several hours suggests that $30,000 is now the main support zone.

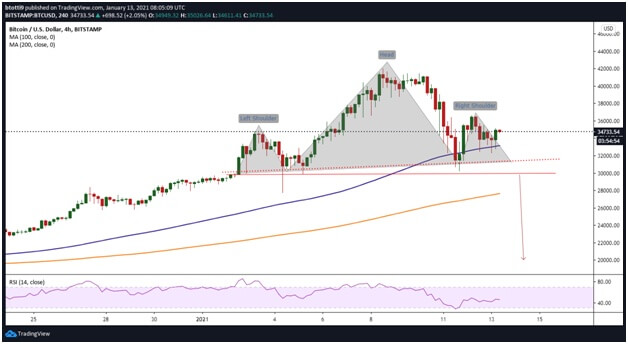
But a bearish outlook in the form of a classic head and shoulders (H&S) pattern on the 4-hour chart hints at a potential short term dip. At the time of writing, BTC/USD is looking likely to complete the pattern’s right shoulder, with the neckline a key level to watch.

According to one analyst, a break below this line might see sellers target a dump to the region around $20,000.

In a video shared to 93.8k followers on Twitter, the analyst notes if the right shoulder of the H&S pattern keeps unfolding and then confirms, we could see Bitcoin drop below $30,000. This is where the neckline lies and it is also the zone of previous support.

In this case, an hourly candle below the critical support level will turn the zone into a resistance area. From here, the pattern’s price target extends to the $20,000 level.

Bitcoin 4-hour price chart showing an unfolding H&S pattern. Source: TradingView

According to the analyst, the bearish scenario only unfolds if the right shoulder confirms and the price breaks below the neckline. If price trends higher, it’s likely to invalidate the bearish picture and see BTC/USD target a breakout to the resistance line at $36,000.

A combination of miners’ heavy selling, reduced stablecoin inflows and no major Coinbase outflows appear to point to a short term dump, according to Ki-Young Ju, the CEO of analytics firm CryptoQuant.

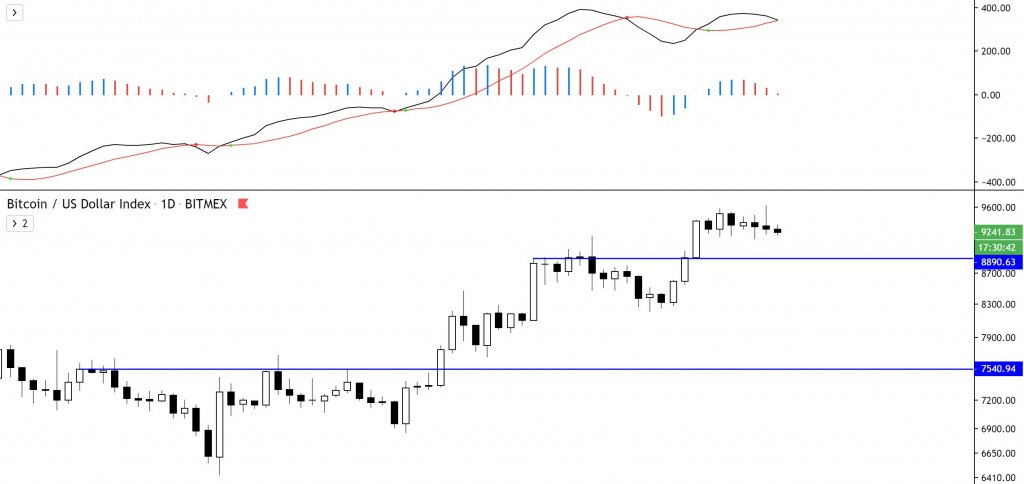
However, while Ki-Young Ju says BTC faces another dump after the recent 28% dip, another analyst believes the market could witness a bullish reversal. According to him, the pop to $34,000 suggests Bitcoin is likely trading within an ascending triangle.

Nonetheless, Jonny Moe notes that BTC/USD is “still inside [a] more localised downtrend”.

As such, bulls need to break the downward trend in order to strengthen the outlook of the triangle pattern.

Bitcoin chart showing possible ascending triangle pattern. Source: Source: Jonny Moe

According to CoinMarketCap, the aggregate BTC/USD value across all exchanges it tracks is $34,868. A bullish reversal could see bulls focus on $40,000 level.

On the downside, the 100-SMA, the psychological $30,000 line and the 200-SMA provide initial support levels should selling pressure mount.

The post Bearish chart pattern suggests Bitcoin could dump to $20k appeared first on Coin Journal.

origin »

Bitcoin price in Telegram @btc_price_every_hour

Bitcoin (BTC) на Currencies.ru

$ 60367.84 (+0.52%)
Объем 24H $41.046b
Изменеия 24h: 3.17 %, 7d: -2.05 %
Cегодня L: $59615.38 - H: $60987.32
Капитализация $1210.435b Rank 1
Цена в час новости $ 34485.79 (75.05%)

pattern bearish dump 20k chart could bitcoin

pattern bearish → Результатов: 126


Фото:

Bitcoin Will Confirm a Massive Bearish Distribution Pattern if it Breaks $8,600

Bitcoin’s long-held consolidation phase came to an end yesterday evening when sellers pushed the benchmark cryptocurrency below $9,000 Although buyers stepped up and quickly defended against further losses, they have been unable to catalyze any type of sharp recovery It now appears that BTC is well positioned to see a notable decline in the days ahead as sellers target the key support at $8,600 If this level is broken below, a massive distribution pattern will […]

2020-6-16 21:00


Фото:

Analysts Target a Sub-$200 Move for Ethereum Once it Taps This Crucial Level

Ethereum has been closely tracking Bitcoin’s price action throughout the past several weeks and months The cryptocurrency did recently form an incredibly bearish technical pattern that analysts are still closely watching There’s a strong possibility that the crypto could be positioned to see notable downside in the near-term due to this pattern One analyst is even targeting a movement down to the sub-$200 region This price action could be magnified by a recent surge in […]

2020-6-15 22:00


Фото:

Ethereum Forms “Compelling” Bearish Reversal Pattern; Here’s What Could Invalidate It

An overnight decline seen by the aggregated crypto market appears to have bolstered the possibility that Ethereum is forming a potent head and shoulders (H&S) pattern This comes as analysts note that they foresee its recent highs to mark a local top It is important to note that there is one upcoming event that could be a catalyst for further bullishness One trader believes this event will help ETH establish a mid-term uptrend in the […]

2020-6-6 23:00


Фото:

Bitcoin Confirms Elusive “Golden Cross” Pattern as Large Buyers Step Up

Bitcoin saw an overnight decline that has caused it to further extend the bout of consolidation that it has been caught within in the time following its sharp rise to $10,000 This latest movement seems to suggest that there is in fact heavy resistance within the lower-$10,000 region Although its inability to gain a solid foothold within this region does seem to be overtly bearish, the crypto was able to form an elusive “golden cross” […]

2020-5-10 19:00


Фото:

Crypto Price Analysis May 5: BTC, ETH, XRP, BCH, BSV, LTC, BNB, EOS, XTZ, LINK

The Bitcoin price has been decreasing inside a bearish pattern since April 30. At the time of writing, the price was trading near $8,900. With the third BTC halving projected to occur on May 12, Google search interest for the event is at an all-time high, a value more than four times the previous all-time […] The post Crypto Price Analysis May 5: BTC, ETH, XRP, BCH, BSV, LTC, BNB, EOS, XTZ, LINK appeared first on BeInCrypto.

2020-5-6 19:15


Фото:

Ethereum Bulls in Serious Trouble as Fractal Forecasts Lower Lows

Ethereum saw a massive rejection from its overnight highs that led it to reel lower today, erasing part of the gains that were incurred during yesterday’s uptrend This has caused the crypto to flash signs of technical weakness, especially while looking towards its Bitcoin trading pair One analyst is also pointing to an extremely bearish XRP fractal pattern that ETH has been closely tracking as a potential reason why lower lows are imminent Ethereum incurred […]

2020-5-1 23:00


Waves, Verge, Ethereum Price: Waves' double bottom pattern shows promise of 23%-37% surge

Only, the Waves token shows promise with the formation of a double bottom pattern. Ethereum and Verge are all exhibiting bearish sentiment. Ethereum is stuck between the 50 and 200DMA while, Verge is The post Waves, Verge, Ethereum Price: Waves' double bottom pattern shows promise of 23%-37% surge appeared first on AMBCrypto.

2020-4-6 23:30


Фото:

Analyst: this pattern shows Bitcoin could be bound for a massive July breakout

The past couple of days have been rocky for Bitcoin (BTC), with the benchmark cryptocurrency facing some notable downwards pressure in the time following its recent rejection at $9,600. It is important to note that the rejection at this level – although bearish over the short-term – may actually throw Bitcoin into a highly bullish […] The post Analyst: this pattern shows Bitcoin could be bound for a massive July breakout appeared first on CryptoSlate.

2020-2-5 06:00


Фото:

XLM Initiates a Strong Bounce at the Range Low

On January 14, the XLM price reached a low of 572 satoshis. It has been increasing since, reaching a high of 751 satoshis on January 19. However, the rally seems to have stalled. The bearish short-term pattern suggests that the XLM price is likely to revisit its breakout level at 660 satoshis before resuming the […] The post XLM Initiates a Strong Bounce at the Range Low appeared first on BeInCrypto.

2020-1-20 21:18


Ethereum Technical Analysis Sees ETH Track BTC Higher

Ethereum has a bullish short-term trading bias and a bearish medium-term outlook The four-hour time frame shows that a bullish inverted head and shoulders pattern has formed The daily time frame shows that a breakout above the $140 level could be very bullish for ETH/USD Ethereum is moving higher on Monday, as the second-largest cryptocurrency […] The post Ethereum Technical Analysis Sees ETH Track BTC Higher appeared first on Crypto Briefing.

2020-1-6 20:46