2024-5-31 05:08 |
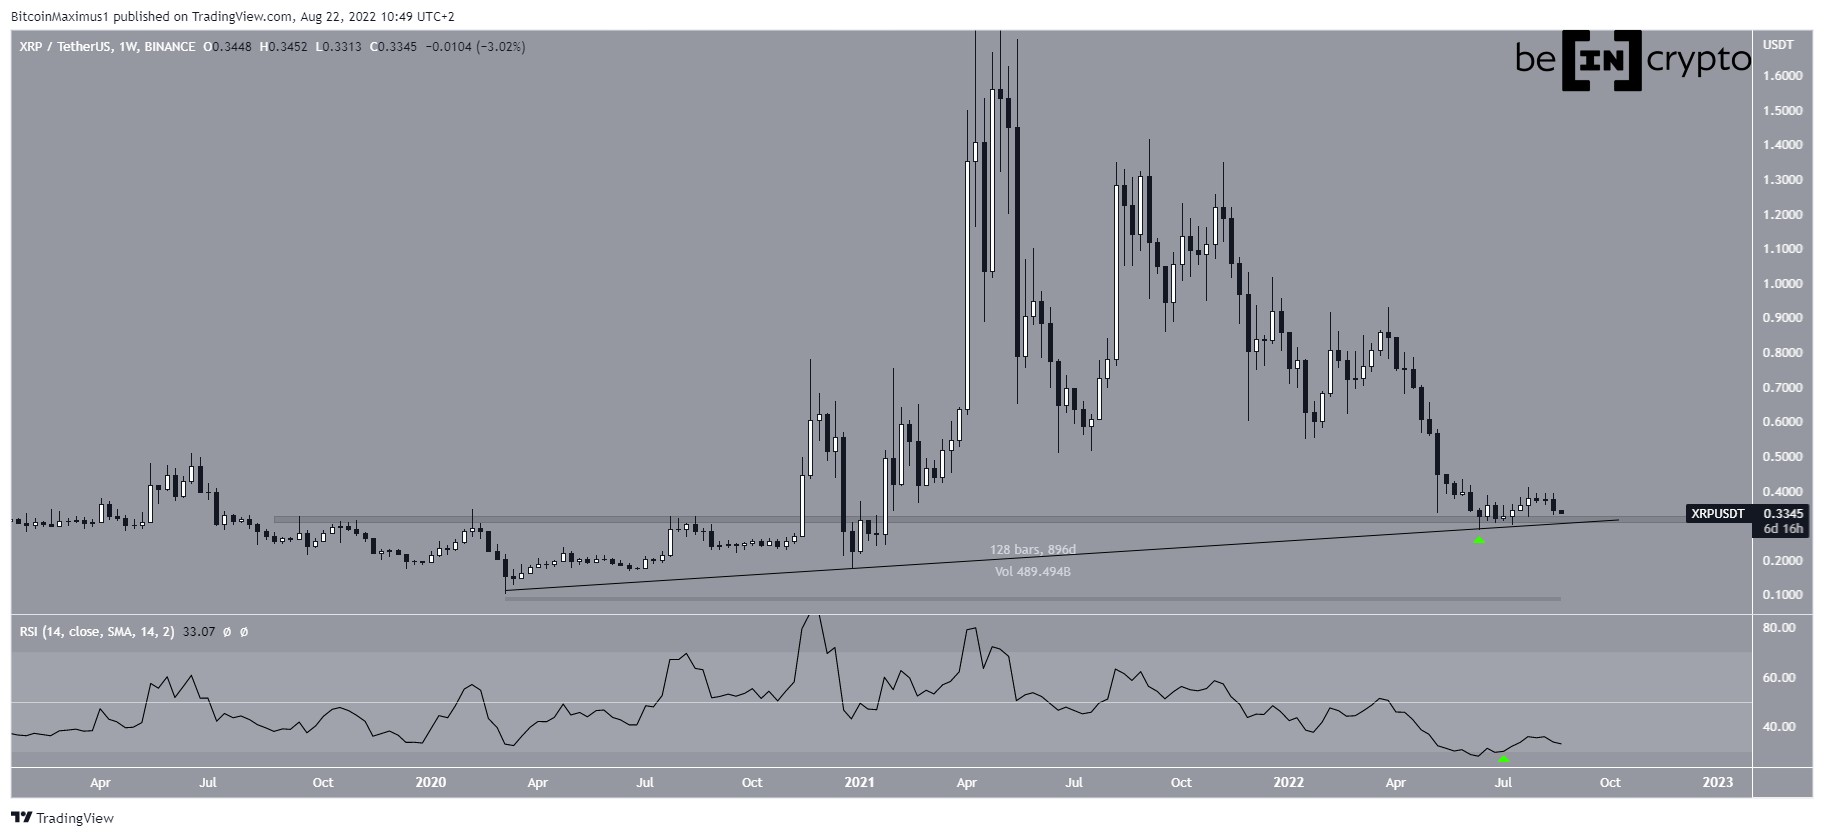
XRP price extended losses below the $0.5220 support zone. It tested the $0.5120 support and now attempting another recovery wave toward $0.550.
XRP is struggling to start a fresh increase above the $0.5320 resistance zone. The price is now trading below $0.530 and the 100-hourly Simple Moving Average. There is a major bearish trend line forming with resistance near $0.5230 on the hourly chart of the XRP/USD pair (data source from Kraken). The pair could continue to move down if the price stays below $0.5320. XRP Price Dips FurtherXRP price remained in a short-term bearish zone like Bitcoin and Ethereum. The bears were able to push the price below the key support at $0.5220. Finally, the price tested the $0.5120 support zone.
A low was formed at $0.5126 and the price is now attempting a fresh recovery wave. There was a move above the $0.5165 level. The price climbed above the 23.6% Fib retracement level of the downward wave from the $0.5406 swing high to the $0.5126 low.
However, the price is still trading below $0.530 and the 100-hourly Simple Moving Average. On the upside, the price is facing resistance near the $0.5220 level. There is also a major bearish trend line forming with resistance near $0.5230 on the hourly chart of the XRP/USD pair.
The first key resistance is near $0.5265 or the 50% Fib retracement level of the downward wave from the $0.5406 swing high to the $0.5126 low. A close above the $0.5265 resistance zone could send the price higher. The next key resistance is near $0.5320.
If there is a close above the $0.5320 resistance level, there could be a steady increase toward the $0.5450 resistance. Any more gains might send the price toward the $0.5650 resistance.
More Downsides?If XRP fails to clear the $0.5220 resistance zone, it could continue to move down. Initial support on the downside is near the $0.5150 level.
The next major support is at $0.5120. If there is a downside break and a close below the $0.5120 level, the price might accelerate lower. In the stated case, the price could decline and retest the $0.50 support in the near term.
Technical Indicators
Hourly MACD – The MACD for XRP/USD is now losing pace in the bearish zone.
Hourly RSI (Relative Strength Index) – The RSI for XRP/USD is now below the 50 level.
Major Support Levels – $0.5120 and $0.500.
Major Resistance Levels – $0.5220 and $0.5320.
origin »Bitcoin price in Telegram @btc_price_every_hour
Lendroid Support Token (LST) на Currencies.ru
|
|