2020-11-4 14:37 |
The XRP price has failed to sustain an upward move that began on Sept 24 and has invalidated its bullish structure.
The price is trading at a significant support level that could trigger a sharp drop if XRP falls below it.
Bullish XRP Structure Breaks DownOn Sept 24, the XRP price reached a low of $0.219 and began an upward move that was following an ascending support line. The price continued to increase until it reached the $0.255 resistance area where it made several unsuccessful breakout attempts.
XRP eventually broke down from the ascending support line and is currently sitting at the $0.23 support level. This is likely the last line of defense in preventing a major move to the downside.
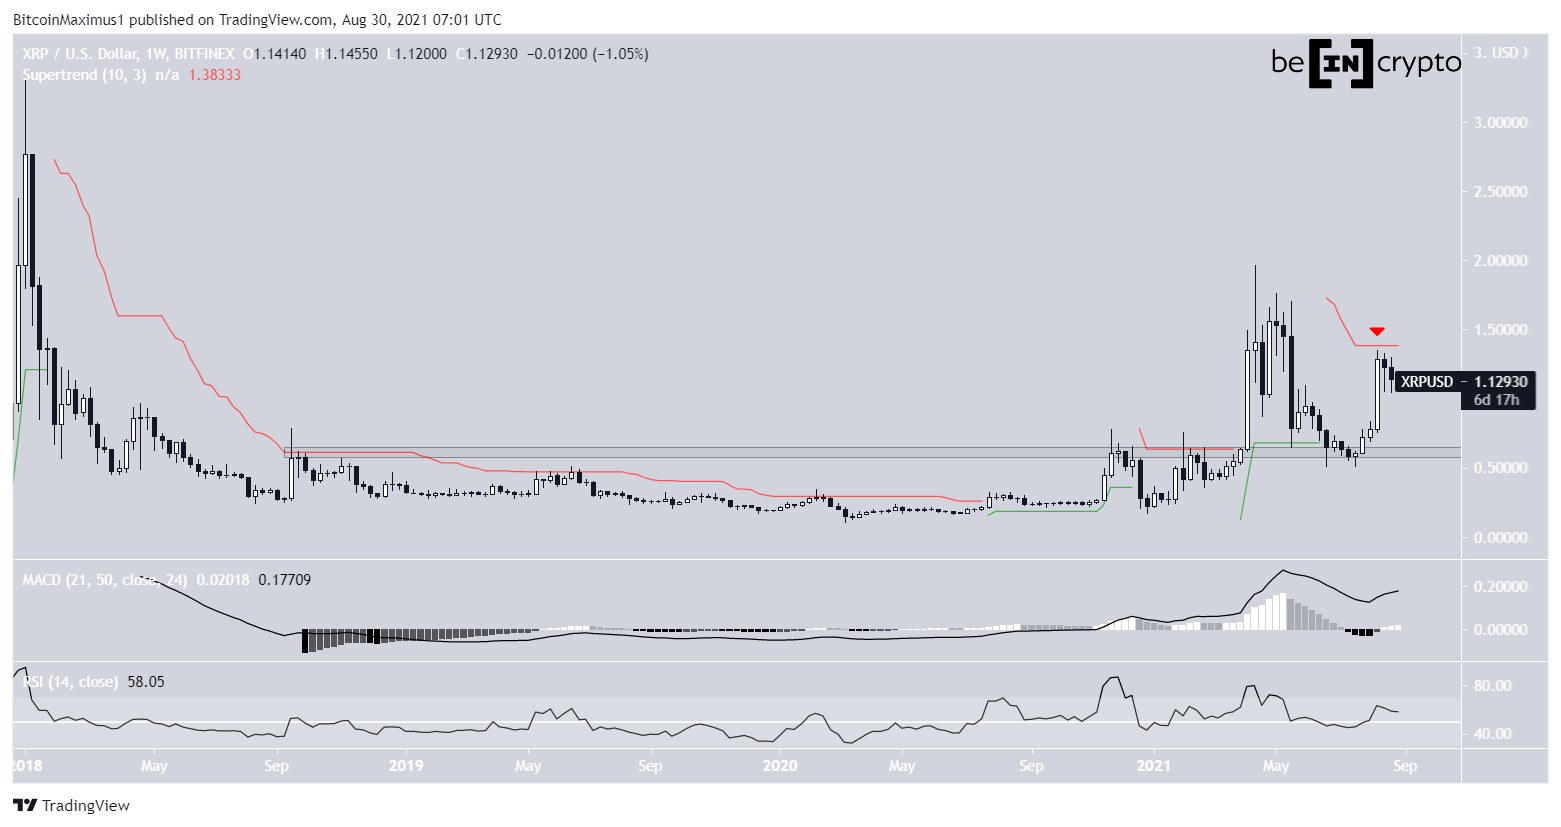
XRP Chart By TradingView Relief Before a Drop?Technical indicators in the daily time-frame are bearish:
The Stochastic Oscillator has made a bearish cross. The MACD is decreasing and is in negative territory. The RSI is decreasing and is below 50.It’s worth mentioning that the aforementioned $0.23 support area is also the 0.618 Fib level of the entire previous upward move. It would therefore be expected to give some type of reaction in helping XPR move up towards the middle of the range.
A decrease below could trigger a drop to the next relevant Fib level at $0.203.
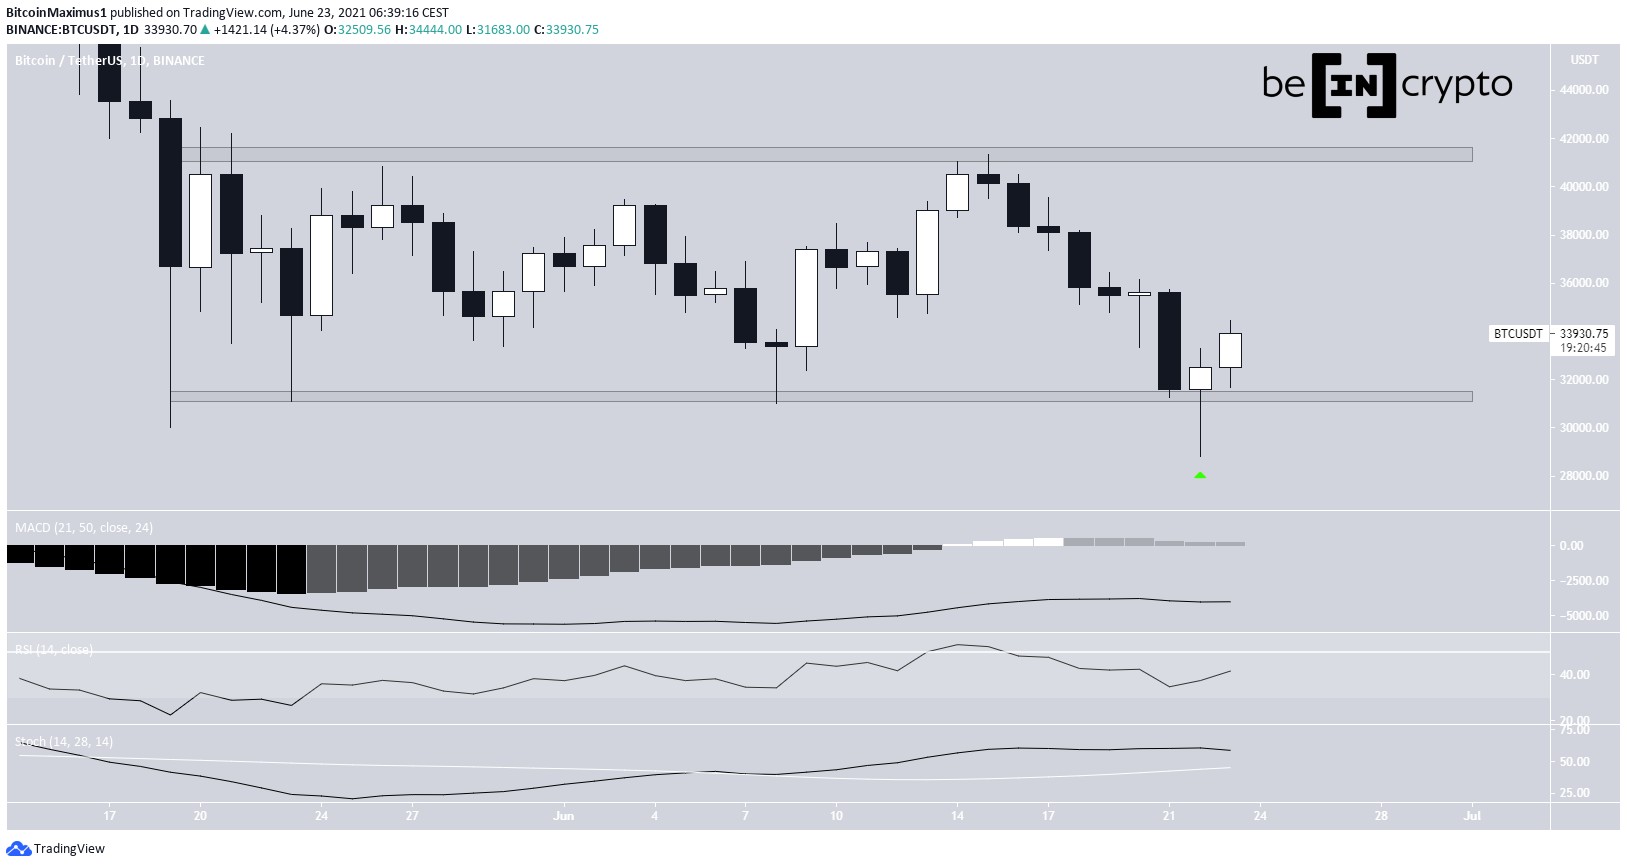
XRP Chart By TradingViewA relief bounce stemming from the current support area would also fit with the reading from the shorter-term technical indicators.
The price has created what resembles a double bottom pattern, which has been combined with a significant bullish divergence in both the RSI and the MACD.
This is a sign that the price could move upwards, with the first target being the minor resistance area at $0.243.
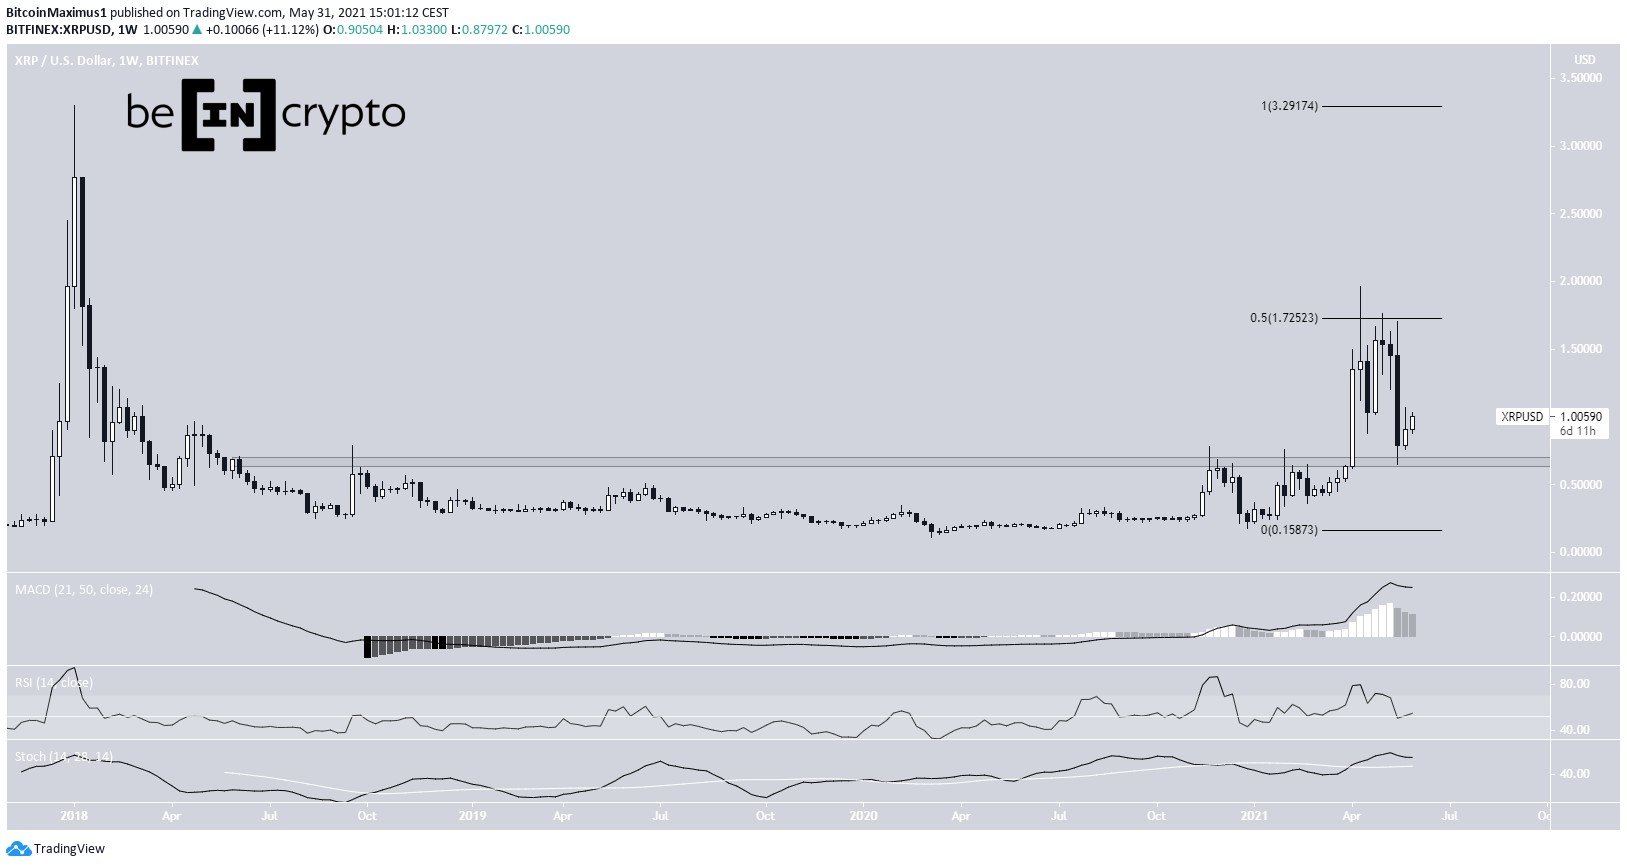
XRP Chart By TradingView Future MovementCryptocurrency trader @davthewave outlined an XRP chart, which shows a final drop to $0.216 before predicting a move alongside a curved ascending support line.
Source: TwitterThe increase from the aforementioned Sept 24 low looks to be an A-B-C corrective structure (orange), which followed a bearish leading diagonal.
The price has returned to the 0.786 Fib level of wave A, a likely spot for a rally to occur. A decrease below the Sept 24 low of $0.217 would invalidate this particular wave count.
While a drop similar to that outlined in the tweet could definitely occur, a dip all the way to $0.216 would invalidate what seems to be the most likely wave count and could cause a breakdown from a long-term support level. In addition, the current increase looks corrective rather than impulsive, reducing the chances of a sustained upward movement.
XRP Chart By TradingView ConclusionXRP is expected to initiate some sort of relief rally, however, if the support area of $0.23 breaks, a sharp drop could follow afterward.
For BeInCrypto’s latest Bitcoin analysis, click here!
Disclaimer: Cryptocurrency trading carries a high level of risk and may not be suitable for all investors. The views expressed in this article do not reflect those of BeInCrypto.
The post XRP Falls Back to Support — Will It Bounce or Break Down? appeared first on BeInCrypto.
origin »Bitcoin price in Telegram @btc_price_every_hour
Ripple (XRP) на Currencies.ru
|
|