2018-11-30 14:00 |
Price predictions have been coming thick and fast over the past couple of weeks since crypto markets took their biggest dive in mid-November. Bitcoin has been the litmus test for the rest of the crypto market which still seems to be hopelessly coupled to its price swings.
Are we at the bottom yet?Analysts and traders have been scrambling to determine whether this is the bottom yet, in order to get in at the optimum time for when things finally recover. To ascertain this many have been looking back to the previous crypto winter in 2014-2015 when Bitcoin fell by a similar percentage.
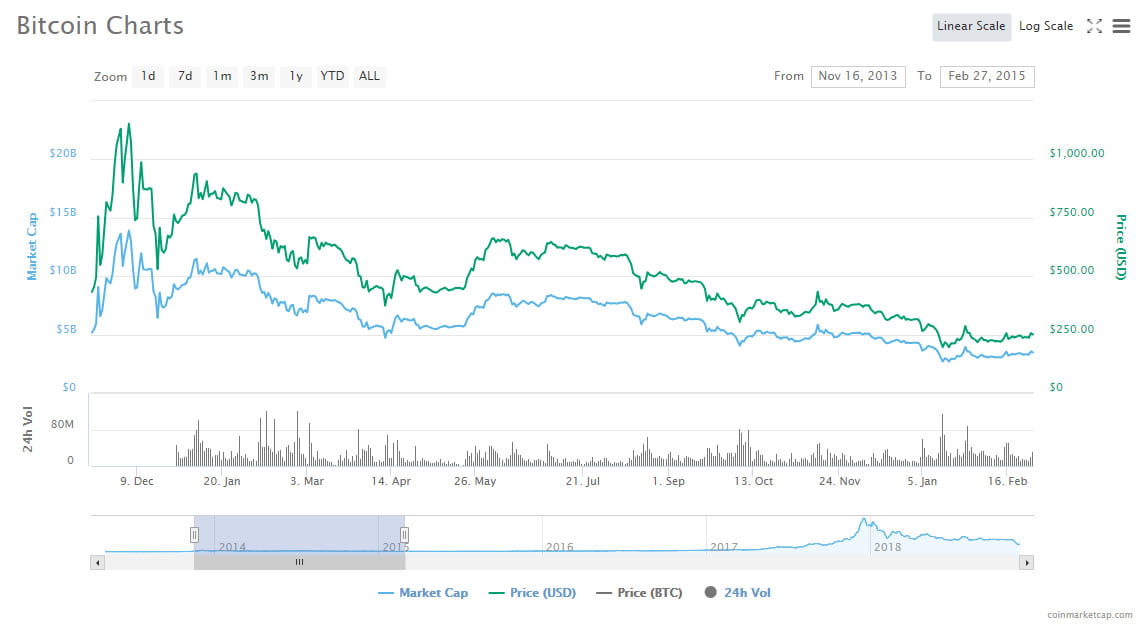
From its high for the time in December 2013 to its lowest point of the bear market in January 2015 Bitcoin lost around 84% according to Coinmarketcap historical charts. It fell from around $1,150 to $180 in the space of a year. The current loss from ATH to low this year has been 82%. Marketwatch has noted that there are similarities in the rate of fall around the bottom back then to this month.
In January 2015 Bitcoin fell 43% in the space of about two weeks from the beginning of the month. In November 2018 Bitcoin has fallen exactly 43% from $6,300 on the 14th to its low for the year of $3,600 in a similar time frame.
Technical strategist at Fundstrat Global Advisors, Rob Sluymer, noted;
“In contrast to bounces that have developed through 2018, weekly RSI [relative strength index] is now at levels not seen since BTC’s last bear market low in early 2015 and BTC is showing very early evidence of responding to its long-term uptrend after three major downside moves through 2018,”
Following Bitcoin’s 2015 low, it stayed range bound between $220 and $280 for around eight months. The breakout came in October of that year when BTC surged over 100% in the space of a month taking it to $500. The recovery had started and the uptrend was in motion, 2016 was a “slow” year but Bitcoin made 130% by the end of it. We all know what happened in 2017.
Others are not so convinced with many still calling for a low of $3,000 before things start to recover. This current rally has been referred to as a ‘dead cat bounce’ on a number of occasions by prominent analysts.
Sluymer added “Our expectation is that BTC is in the very early stages of establishing a multi-quarter bottoming process that is likely to extend well into mid-2019.” This sentiment seems to be echoed around the crypto sphere at the moment as Bitcoin mimics patterns not seen for four years.
Image from Shutterstock
The post Will History Repeat? Bitcoin Price Patterns Repeating Previous Market Cycle appeared first on NewsBTC.
origin »Bitcoin price in Telegram @btc_price_every_hour
Emerald Crypto (EMD) на Currencies.ru
|
|