2023-9-26 15:00 |
The price of Chainlink (LINK) has broken out from a descending resistance line and is approaching its yearly high.
The weekly and daily timeframe readings are bullish, supporting the continuing increase toward new highs.
Is LINK Price Yearly High Within Reach?The technical analysis in the weekly timeframe shows that the LINK price had increased since June, when it had fallen to a low of $4.75. The increase caused a reclaim of the $5.80 horizontal support area, which has been in place since April 2022.
While this is considered a bullish sign, LINK failed to break out from a descending resistance line (red icon). Despite this failure, the price is making another attempt at doing so.
Empower your investments with LINK price predictions.
The upward movement was also combined with a bullish divergence (green line) in the weekly RSI. The RSI is a momentum indicator used by traders to evaluate whether a market is overbought or oversold and to determine whether to accumulate or sell an asset.
Readings above 50 and an upward trend suggest that bulls still have an advantage, while readings below 50 indicate the opposite. A bullish divergence occurs when a price decrease is combined with a momentum increase. It often leads to bullish trend reversals.
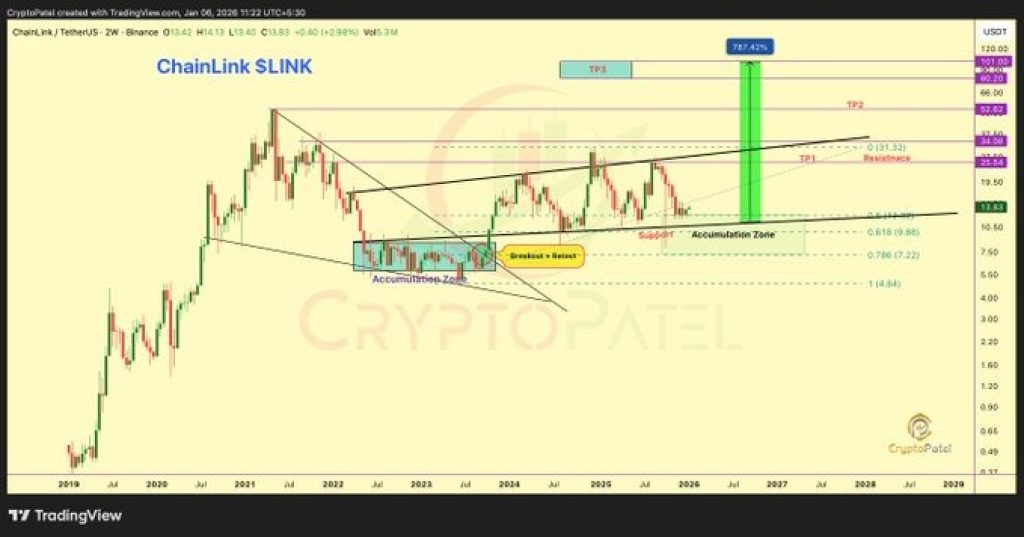
LINK/USDT Weekly Chart. Source: TradingViewIf a breakout from the long-term descending resistance line occurs, the LINK price could significantly increase. In that case, the closest resistance will be at $9.40, an increase of 25% measuring from the current price. On the other hand, a return to $5.80 would be a drop of 20%.
Read More: 6 Best Copy Trading Platforms in 2023
How Long Will Chainlink Continue Increasing?The daily time frame provides a bullish reading, aligning with the weekly timeframe.
Firstly, the LINK price broke out from a descending resistance line on September 18. This suggests that the previous downward movement has ended.
Secondly, the daily RSI has moved above 50, another sign of a bullish trend.
The Elliott Wave count also supports the continuing increase. Technical analysts utilize the Elliott Wave theory to ascertain the trend’s direction by studying recurring long-term price patterns and investor psychology.
There are two potential counts for the future movement, both leading to a short-term LINK price increase.
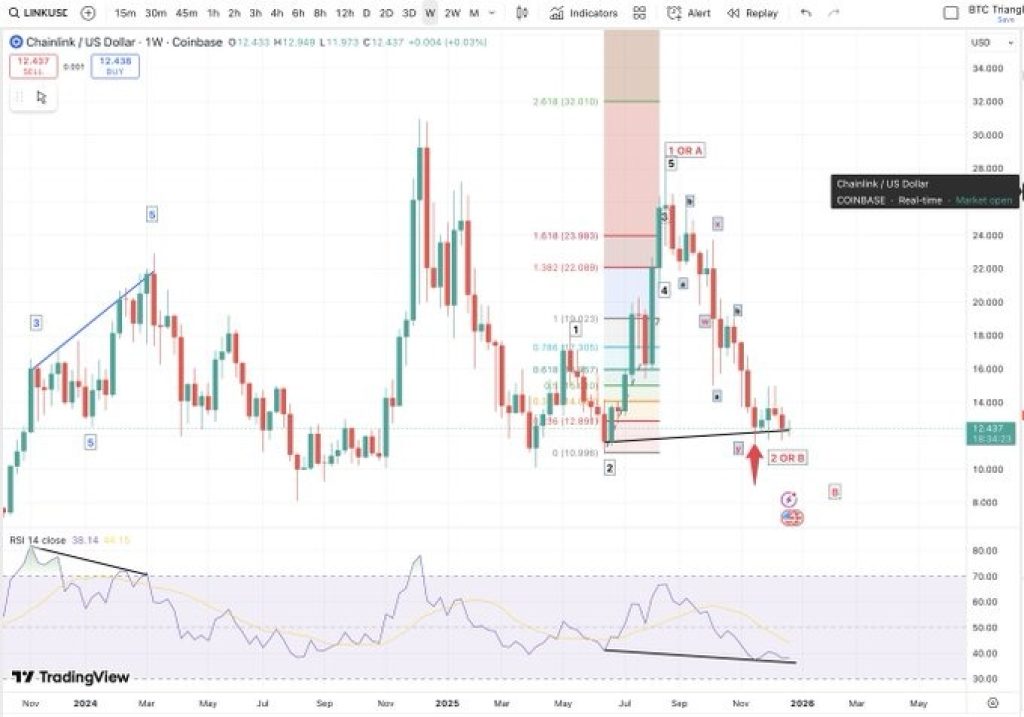
The bearish count (black) indicates that the upward movement is part of an A-B-C corrective structure. Giving waves A:C a 1:1 ratio would lead to a high near $9.50, aligning with the long-term resistance area.
The bullish count (white) suggests that the price is currently in wave three of a five-wave increase. In this case, wave three will likely extend, and LINK will reach a high near at least $12, breaking out from the long-term descending resistance line in the process.
LINK/USDT Daily Chart. Source: TradingViewDespite this bullish LINK price prediction, a sudden loss of momentum or rejection from the descending resistance line could lead to a 20% drop in the $5.90 horizontal support area.
Read More: How To Make Money in a Bear Market
For BeInCrypto’s latest crypto market analysis, click here.
The post Will Chainlink (LINK) Price Reach a New Yearly High? appeared first on BeInCrypto.
origin »Bitcoin price in Telegram @btc_price_every_hour
ChainLink (LINK) на Currencies.ru
|
|