2023-6-21 16:00 |
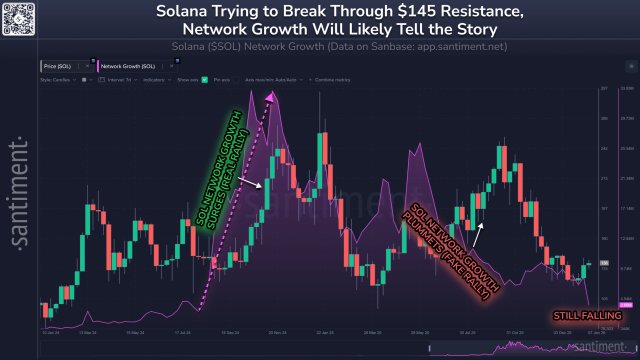
The Solana (SOL) price failed to sustain its increase despite a breakout from a bullish pattern. This led to a sharp fall starting on June 5.
The price action and wave count both indicate that more downside is expected until the SOL price eventually bottoms.
Solana Falls Below Long-Term SupportThe daily time frame technical analysis for SOL shows that the price has fallen since April 17. Solana created a lower high on June 4 (red icon) before accelerating its rate of decrease. The drop led to a low of $12.80 on June 10.
The decrease was crucial since it also caused a breakdown from the $17 horizontal support area. Before the drop, the area had been in place since the beginning of the year. It is expected to provide resistance again in case SOL retests it.
SOL/USDT Daily Chart. Source: TradingViewThe weekly RSI provides mixed signs. The RSI is a momentum indicator traders use to evaluate whether a market is overbought or oversold and to determine whether to accumulate or sell an asset.
Readings above 50 and an upward trend suggest that bulls still have an advantage, while readings below 50 indicate the opposite. While the RSI is increasing, it is still below 50. However, it moved outside of its oversold territory (green circle), a sign associated with the start of bullish trend reversals.
Read More: Top 11 Crypto Communities To Join in 2023
SOL Price Prediction: When Does Wave Count Predict Bottom?Staying in the daily time frame, the wave count also indicates that more downside is expected. Utilizing the Elliott Wave theory, technical analysts examine long-term price patterns and investor psychology that recur to determine the direction of a trend.
The wave count suggests that the price is nearing the top of wave four in a five-wave downward movement (black). The fact that the price trades at a confluence of resistance levels, horizontal and diagonal, supports this possibility.
The SOL price will fall toward $10.42 if the count is correct. The target is found using the 1.61 external Fib retracement of wave four.
SOL/USDT Daily Chart. Source: TradingViewDespite this bearish SOL price prediction, an increase above the wave one low (red line) of $18.72 will mean that the trend is bullish instead.
The SOL price can move to the next resistance at $23 in that case.
More From BeInCrypto: 9 Best AI Crypto Trading Bots to Maximize Your Profits
For BeInCrypto’s latest crypto market analysis, click here.
The post Why Solana (SOL) Price is Still at Risk Despite 30% Recovery appeared first on BeInCrypto.
origin »Bitcoin price in Telegram @btc_price_every_hour
ETH/LINK Price Action Candlestick Set (LINKETHPA) на Currencies.ru
|
|