2023-5-9 12:30 |
The Stacks (STX) price failed to sustain a breakout from a resistance line, putting its validity in doubt.
Moreover, the price trades in a short-term bearish pattern, a breakdown from which could catalyze a sharp downward movement, confirming that the previous breakout was not valid.
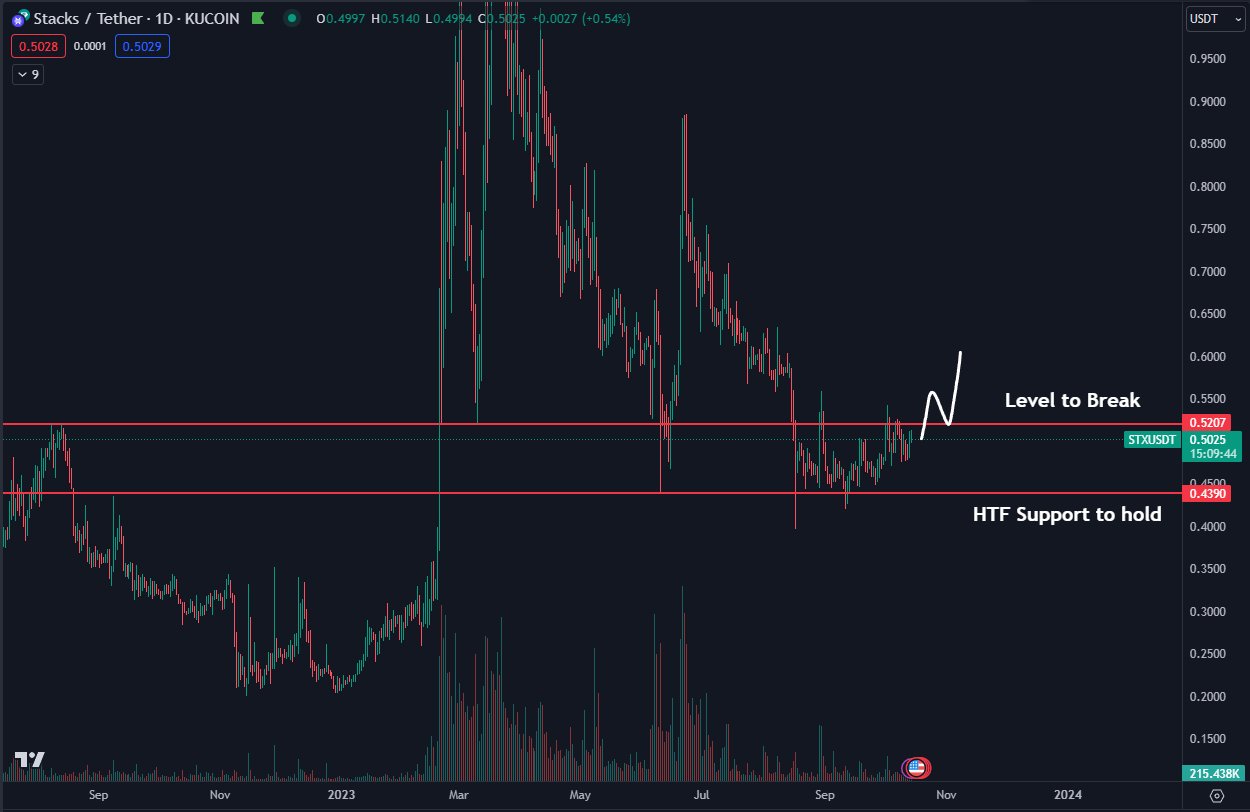
Stacks Price Fails to Sustain BreakoutThe price of STX broke out from a descending resistance line on May 2. The line had been in place since March 20. After such breakouts, the price is expected to initiate a significant upward movement.
However, the STX price failed to do so. Rather, it fell almost immediately after the breakout and now trades at pre-breakout levels. This is considered a bearish sign since it casts doubt on the validity of the breakout.
STX/USDT Daily Chart. Source: TradingViewThe Relative Strength Index (RSI) indicator also gives a bearish reading. Traders utilize the RSI as a momentum indicator to assess whether a market is overbought or oversold, and to determine whether to accumulate or sell an asset.
If the RSI reading is above 50 and the trend is upward, bulls still have an advantage, but if the reading is below 50, the opposite is true. The current reading is below 50, a sign of a bearish trend.
Additionally, the rejection from the 50-line coincided with the failed breakout, suggesting that it was not valid.
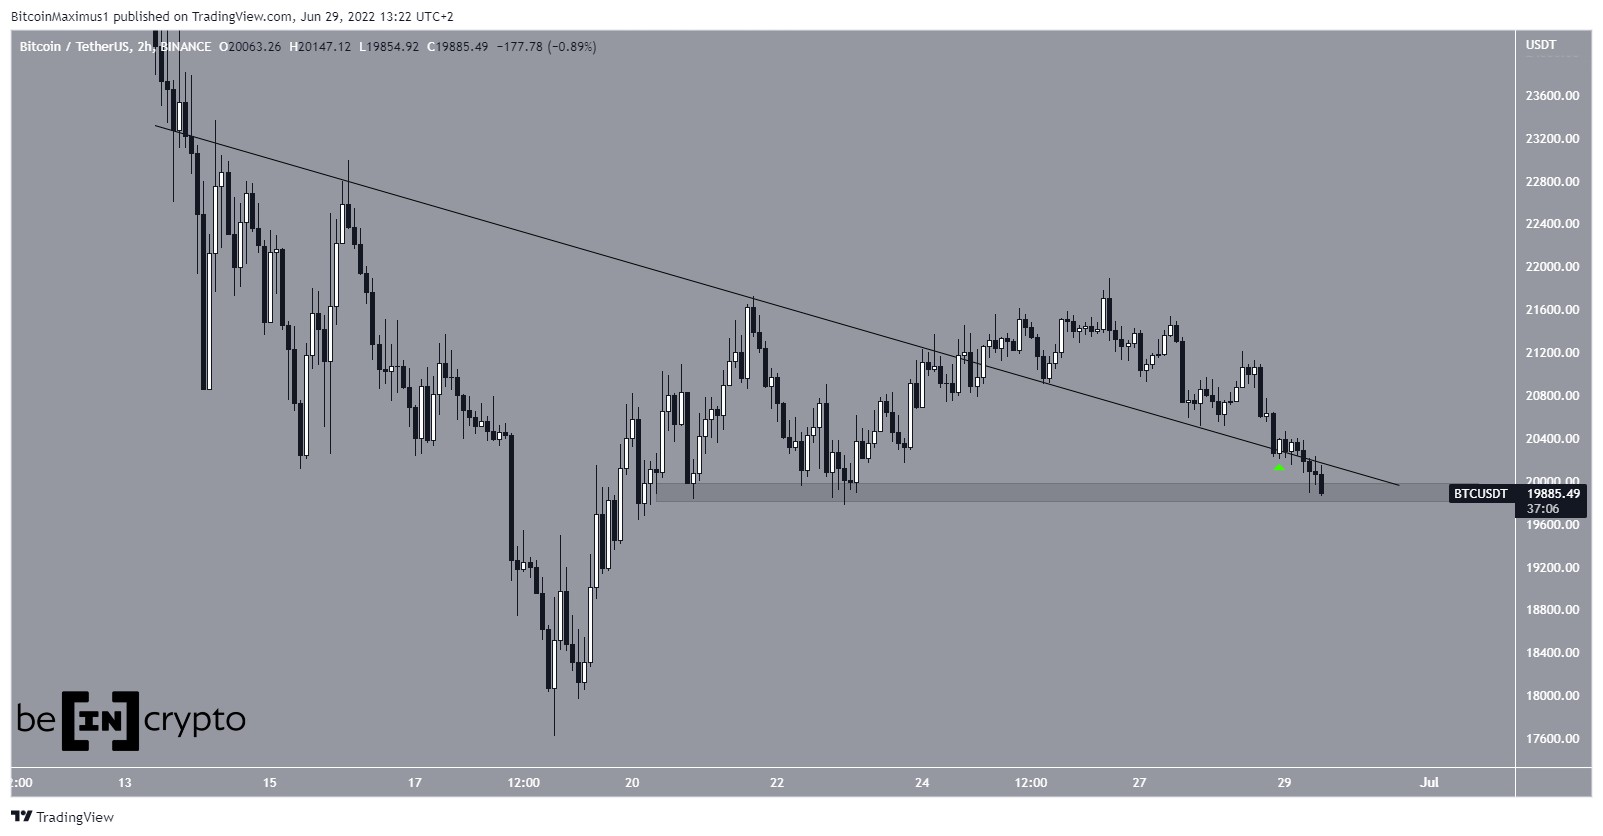
STX Price Prediction: Is a Breakdown Imminent?The technical analysis from the short-term six-hour time frame shows that the STX coin price could begin a significant downward movement.
Firstly, the price trades inside an ascending parallel channel are considered a corrective pattern. This means that an eventual breakdown from it is the most likely scenario.
The fact that the price trades in the lower portion of the channel makes a breakdown more likely.
Next, the RSI is below 50 and in the process of breaking down from its bullish divergence trendline. If a price and RSI breakdown occur, it will confirm that the trend is bearish, and a drop to the previously outlined $0.55 area will transpire.
Besides the current support at $0.67, the next long-term support area is at $0.55. On the other hand, the closest resistance is at $1.0.
STX/USDT Six-Hour Chart. Source: TradingViewThus, breaking out from the channel will invalidate this bearish STX price prediction. The Stacks price can move to the $1.0 resistance area in that case.
For BeInCrypto’s latest crypto market analysis, click here.
The post What’s in Store for Stacks (STX) Price After April’s 25% Drop? appeared first on BeInCrypto.
origin »Bitcoin price in Telegram @btc_price_every_hour
Stox (STX) на Currencies.ru
|
|