2022-6-4 19:00 |
Be[In]Crypto takes a look at the five cryptocurrencies that increased the most last week, more specifically from May 28 to July 3.
These cryptocurrencies are:
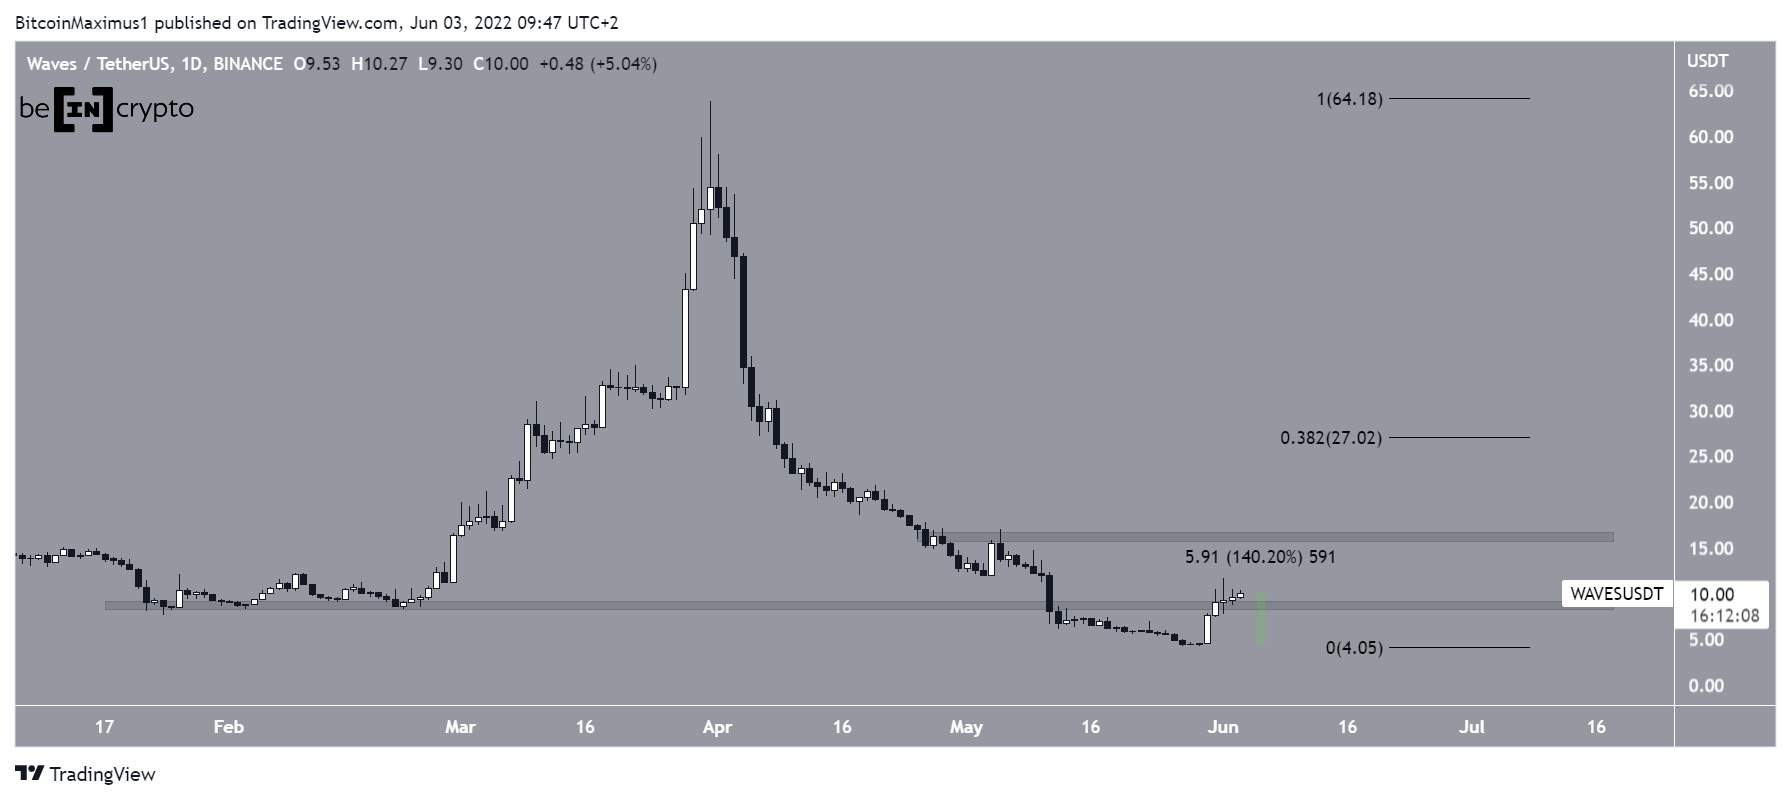
Waves (WAVES) : 116.47%Cardano (ADA) : 25.70%Internet Computer (ICP) : 23.65%Stellar (XLM) : 21.56%Helium (HNT) : 20.42% WAVESWAVES has been falling since reaching an all-time high price of $63.88 on March 31. The downward movement led to a low of $4.13 on May 29. Afterwards, it initiated a sharp upward movement that is still ongoing.
Since its May 29 lows, WAVES has increased by 140% and reclaimed the $9 horizontal area in the process.
If the increase continues, the closest horizontal resistance level is at $16 while the closest Fib resistance level is at $27.
WAVES/USDT Chart By TradingView ADAADA has been increasing inside an ascending parallel channel since May 12. Such channels usually contain corrective movements, meaning that a breakdown from it would be likely.
On May 31, the price was rejected by the resistance line of the channel (red icon) and has been falling since. It is currently holding on above the middle of the channel (red circle). A decrease below this level would indicate that a breakdown and lower prices are forthcoming.
ADA/USDT Chart By TradingView ICPICP has been falling since it was rejected on June 2 (red icon). The downward movement served to validate the $9.40 area as resistance.
If the decrease continues the closest support would be at $7.70, created by an ascending support line.
ICP/USDT Chart By TradingView XLMXLM has been falling underneath a descending resistance line since April 4. The downward movement led to a low of $0.10 on May 12.
XLM bounced afterwards and broke out from the line on May 30.
It is currently attempting to break out from the $0.155 resistance area. If it is successful in doing so, the next resistance would be at $0.187.
XLM/USDT Chart By TradingView HNTHNT has been falling underneath a descending resistance line since Nov 7. The downward movement led to a low of $6.24 on May 12.
The price bounced afterwards, seemingly creating a double bottom pattern. But it was rejected by the $10 resistance area on May 30 (red icon) and has been falling since. The $10 area also coincides with the aforementioned descending resistance line.
Until HNT manages to reclaim both of them, the trend cannot be considered bullish.
HNT/USDT Chart By TradingViewFor Be[in]Crypto’s latest bitcoin (BTC) analysis, click here
The post WAVES Reclaims $9 Area After $140% Drop: Biggest Weekly Gainers appeared first on BeInCrypto.
origin »Bitcoin price in Telegram @btc_price_every_hour
Dropil (DROP) на Currencies.ru
|
|