2019-1-12 08:12 |
VET/USD Long-term Trend: Ranging Resistance levels: $0.0080, $0.0090, $0.010 Support levels: $0.0040, $0.0030, $0.0020
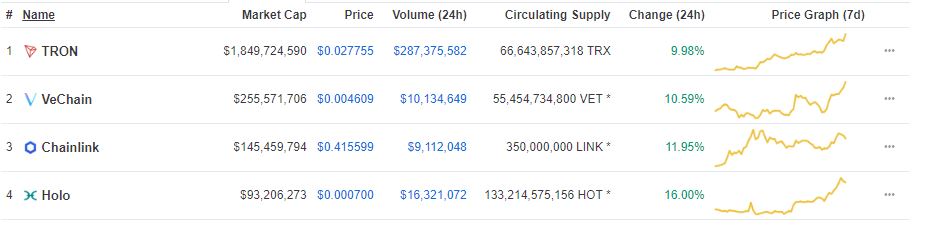
The VET/USD pair had been in the bearish trend zone since January 2019. On January 8, the bulls broke above the 12-day EMA and the 26-day EMA to reach the high of $0.00494. However, the bears immediately pulled back to the bearish trend zone. The crypto had fallen to the low of $0.04044 and commenced a range bound movement.
Meanwhile, the stochastic indicator is approaching the oversold region but above the 20% range indicating that the price of Vechain is in a bearish momentum and a sell signal. This is an indication that the crypto is likely to fall. Also, the crypto’s price is below the 12-day EMA and the 26-day EMA indicating that price of Vechain is likely to fall. If the bearish pressure continues the crypto will revisit the previous low of $0.00332.
The views and opinions expressed here do not reflect that of BitcoinExchangeGuide.com and do not constitute financial advice. Always do your own research.
origin »Bitcoin price in Telegram @btc_price_every_hour
CK USD (CKUSD) на Currencies.ru
|
|