Uniswap Price Consolidates At $7, Chance Of Moving Past Resistance Remains Bleak

2022-8-22 07:00

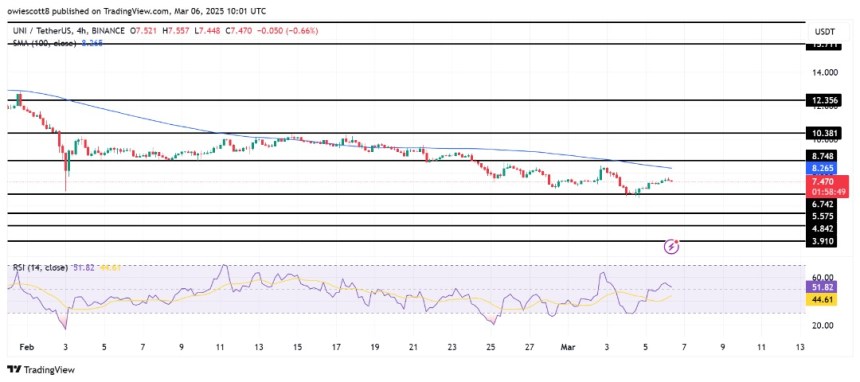
Uniswap price displayed almost no movement over the last 24 hours as the coin registered 0.8% downward movement on its chart. UNI was hovering around the $7 price level and was unable to break past its closest price ceiling. If the coin does not manage to move past the resistance level then it could lose its support line.

Technical outlook for Uniswap price indicated that could it register further drop on the chart. Move to the above resistance level will be difficult as buyers have exited the market. Increased selling pressure can push Uniswap price to the next support level.

Bitcoin price also fell considerably over the last 24 hours. The coin fell to $21,000 and the altcoins moved in the same direction. Broader market weakness have made Uniswap price remain at the current price level. The global cryptocurrency market cap today is at $1.07 Trillion, with a 1.0% negative change in the last 24 hours.

Uniswap Price Analysis: Four Hour Chart Uniswap was priced at $7.01 on the four hour chart | Source: UNIUSD on TradingView

UNI was trading for $7.01 at the time of writing. The overhead resistance for the coin stood at $7.57. Uniswap price has been unable to move past the price ceiling which is why the coin was met with selling pressure.

A fall from the current price level will push Uniswap price to $6.90 immediately, if the coin cannot remain steady over the aforementioned level then the next price level stood at $5.99. Amount of Uniswap traded in the last session fell which meant that the selling pressure was high in the market.

Technical Analysis Uniswap depicted fall in buying strength on the four hour chart | Source: UNIUSD on TradingView

UNI was moving laterally and this has caused selling pressure to mount on the four hour chart. It was also an indication that an upcoming fall in chart could be expected.

The Relative Strength Index was in the oversold region however, over the last 24 hours the coin noted an uptick.

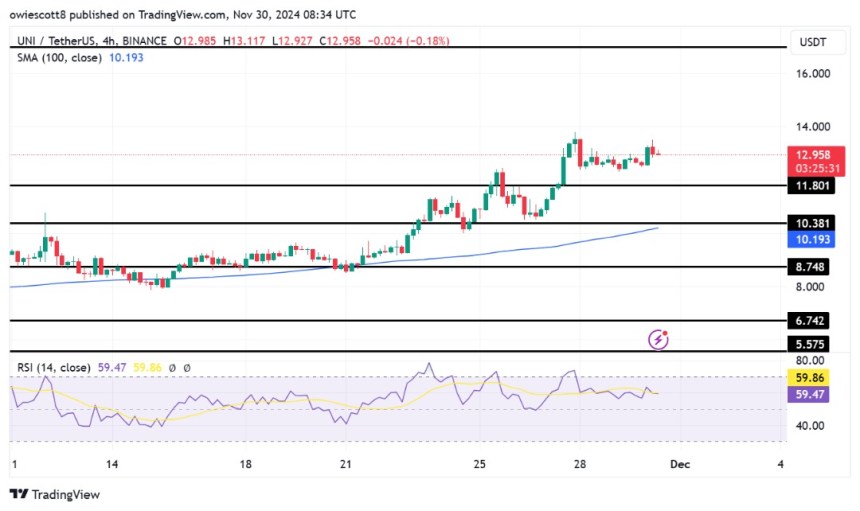
Despite the uptick sellers were considerably higher than buyers on the four hour chart. Uniswap price was below the 20-SMA line which indicated that sellers were driving the price momentum in the market.

Uniswap registered buy signal on the four hour chart | Source: UNIUSD on TradingView

UNI’s laterally trading had pushed price near to its immediate support level. The influx of sellers made technical indicator point towards a sell signal however over the last 24 hours the coin started to capture a buy signal.

The Moving Average Convergence Divergence depicts the price momentum and reversal in the same. MACD underwent a bullish crossover with green histograms on the half-line which meant that there was buy signal for the coin.

Bollinger Bands help understand the price volatility and chance of price fluctuation. Bands were wide open and parallel which suggested that price might witness a move up or down over the upcoming trading sessions.

Featured image from Katoch Tubes, chart from TradingView.com

Similar to Notcoin - TapSwap on Solana Airdrops In 2024

origin »

ETH/LINK Price Action Candlestick Set (LINKETHPA) на Currencies.ru

$ 467.1 (+0.48%)
Объем 24H $0
Изменеия 24h: 0.85 %, 7d: 17.53 %
Cегодня L: $453.49 - H: $467.1
Капитализация $0 Rank 3676
Доступно / Всего 0 LINKETHPA

price past movement uniswap uni downward chart

price past → Результатов: 126


Ethereum May Surge 35% to $200 in Near-Term; What Will Fuel It?

Throughout the past month, the price of Ethereum (ETH) increased from $126 to $140, by more than 11 percent against the U. S. dollar. Similar to how several strategists expect the bitcoin price to increase substantially if it breaks the $4,200 resistance level in the near-term, traders foresee Ethereum rising to as high as $200 if it rebounds over crucial levels.

2019-3-31 13:29


Фото:

Bitcoin Price Analysis: Upward Drift Continues Following Established Macro Support

Since mid-February, the bitcoin market has continued to drift upward toward a band of strong, macro resistance (shown below as a red band). This slow, drift upward marks our fourth test of the resistance zone and, unlike the three prior tests, our rejection of the level has shown a weakness on the side of the bears:Figure 1: BTC-USD, Daily Candles, Fourth RejectionIf we compare the three prior rejections (labeled 1, 2 and 3), we see that the move into this resistance level was violent — and had equally violent rejections.

2019-3-29 02:21


EOS Price Analysis: Cryptocurrency surges by 14% as EOS gets podium finish on Weiss Ratings

EOS, the fourth largest cryptocurrency on CoinMarketCap was surging for the past few days. This hike can be linked to the release of Weiss Crypto Rating’s annual crypto report. It awarded EOS the second position and an A grade for its promising tech/adoption for long-term investors and an attractive risk/reward for short-term investors.

2019-3-28 18:30


Cardano [ADA] price set to bounce off resistance and head downwards; Here are the important levels to look out for

Cardano, the tenth largest cryptocurrency on CoinMarketCap had a decent rally over the past few days. The price of the cryptocurrency surged by 133% since December 16, 2018. However, the rally seems to be coming to an end as price candles have formed at the end of the ascending channel/rising channel.

2019-3-28 16:45


Newsflash: Bitcoin Price Stumbles Below $4,000; No Fret, A Swift Rebound is Coming

In the past several hours, the bitcoin price slipped below the $4,000 mark from $4,035 to $3,934, recording a 1 percent drop against the U. S. dollar. Given the fact that it took nearly three weeks for bitcoin to break out of the $3,000 region and reach $4,000, the sudden drop in the price of bitcoin below the $4,000 level initially led traders to reconsider the near-term price trend of the dominant cryptocurrency.

2019-3-26 11:50


Фото:

Ravencoin Price: Demand Is Outstripping RVN Supply

Ravencoin (RVN) doesn’t feature much in crypto coverage. Since it launched last January, the asset tokenization platform has largely stayed on the sidelines. With such a low profile, few noticed Ravencoin becoming one of the best performing digital assets over the past month – although an amusing Redditor, SlappyMcFartsack has dubbed the phenomenon ‘The Flappening’.

2019-3-25 21:50


Bitcoin Price: Key Technical Indicator Shows BTC Surging to $5,500

Throughout the past three months, the bitcoin price has flirted with the $4,200 resistance level, often struggling to maintain momentum above the key $4,000 mark. Several traders have demonstrated concerns over the extended period of stability demonstrated by bitcoin because, in late 2018, the cryptocurrency recorded a drop of around 50 percent following three months of stagnation in the $6,300 to $6,500 range.

2019-3-24 21:30


Фото:

Bitcoin Price Analysis: Slow Upward Drift Tests Market Supply

A slow, grinding upward drift has been the name of the game for bitcoin’s market over the last few weeks. The upward drift is bringing us slowly to a level that was previously rejected violently:Figure 1: BTC-USD, Daily Candles, Upward DriftOur third rejection of the red resistance level shown above brought the market into a test of macro support in the mid-$3,000s.

2019-3-23 01:23


Фото:

Op Ed: With Bitcoin, Anarchy Is the Point, Not the Problem

Last week, there was a panel at SXSW that was effectively a debate on the merits of permissioned blockchains versus permissionless systems like Bitcoin. I listened to the entire audio of the panel discussion, after Programming Bitcoin author Jimmy Song tweeted it out the other day, and I thought he did an awesome job of pointing out the key value proposition of Bitcoin and why it is not worth comparing to permissioned systems.

2019-3-23 17:29