TRX’s Bullish Reversal Pattern Reaffirms the Bullish Trend

TRX’s Bullish Reversal Pattern Reaffirms the Bullish Trend
фото показано с : beincrypto.com

2020-2-25 05:18

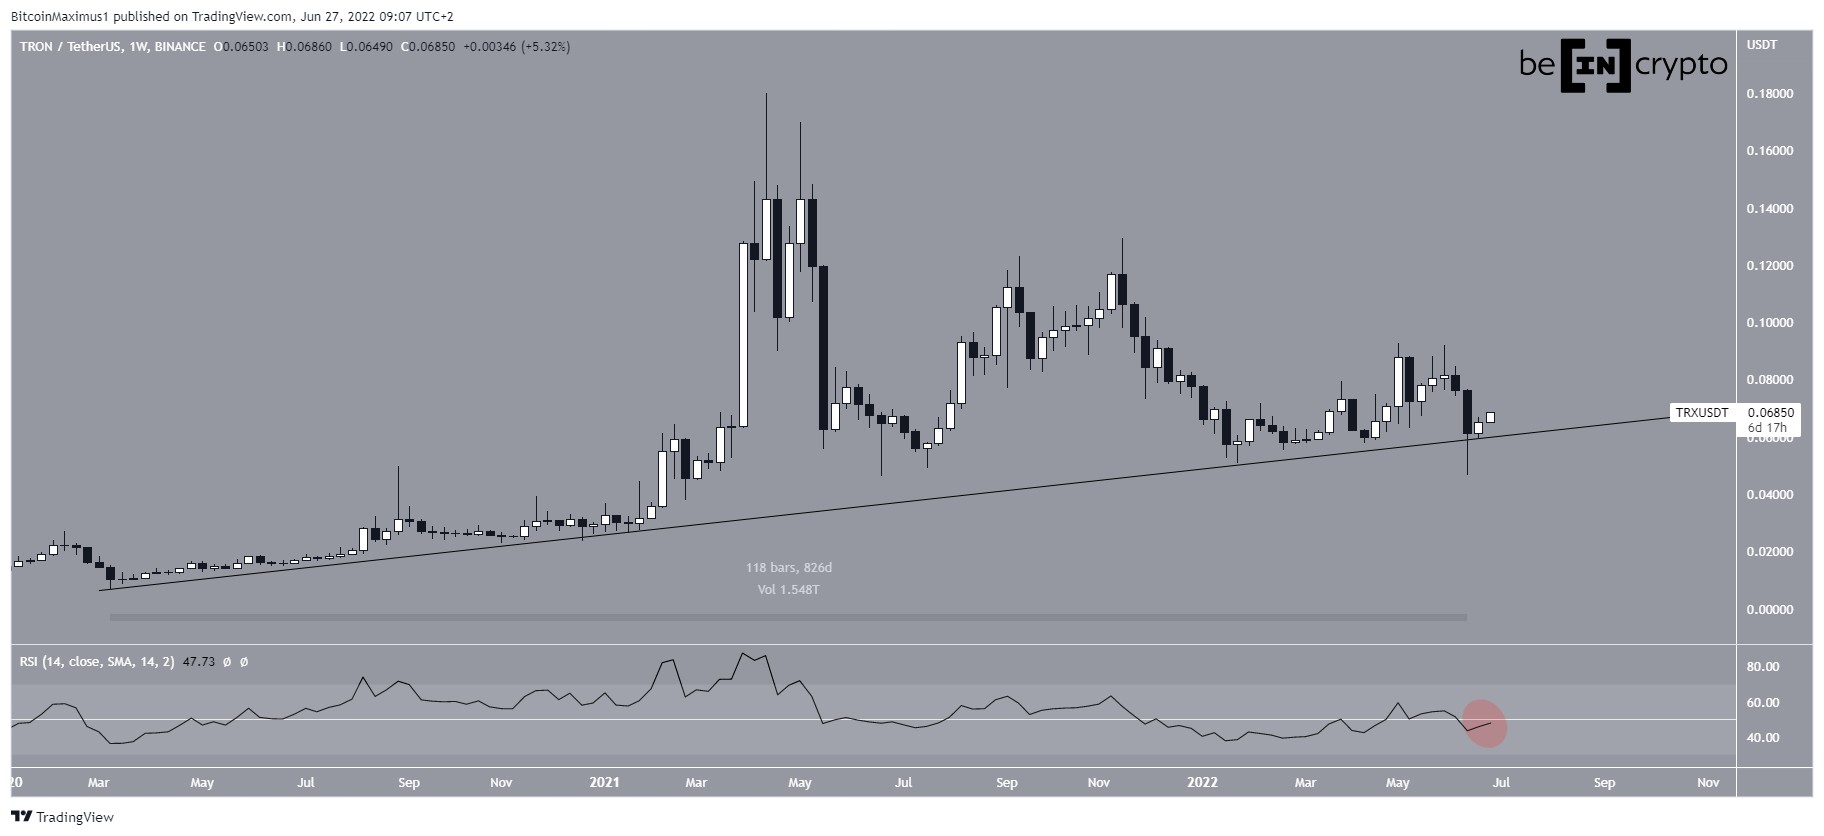
The TRX price has successfully completed a double bottom, which is considered a bullish reversal pattern. As long as it stays above the $0.02 area which is now acting as support, we are expecting the price to continue moving upwards.

Tron (TRX) Price Highlights TRX/USD Has successfully completed a double bottom. There is support & resistance at $0.02 and $0.03. The weekly RSI is bullish. The price is following an ascending support line TRX/BTC Is likely in the third wave of a five-wave Elliott formation. It is in the fifth subwave of the longer-term third wave.

Cryptocurrency investor and trader @George1Trader tweeted a TRX chart stating that he believes it is almost time to buy this coin.

$TRX

Almost time to buy some shitcoin tron? pic.twitter.com/LKPHOYUCUp

— George (@George1Trader) February 21, 2020

Let’s take a closer look at the TRX price chart and determine if it is actually a good time to buy TRX.

TRX/USD

In the period from September-December 2019, the price completed a double bottom near $0.0125, with the high between them being at $0.02. Afterward, the price increased above the $0.02 area and is now in the process of validating it as support.

The weekly RSI is bullish since it has increased above 50.

The next resistance area is found at $0.030. As long as the price stays above $0.02, we expect the price to continue moving towards its target.

The price has been following an ascending support line since January 2.

In addition, a bullish cross has transpired between the 50- and 200-day moving averages (MA), both of which are giving support to the current price.

Finally, the daily RSI has also moved above 50. All these bullish signs make us think that the TRX price will increase and eventually reach $0.03. The lack of a resistance line makes it unable to predict when the price will do so.

TRX/BTC

In our previous analysis, we have outlined a possible five-wave Elliott formation for TRX. Since we are likely in the third wave, which is projected to end near 270 satoshis in the middle of March, let’s try to analyze each sub-wave on its own for a more accurate prediction.

The most likely scenario is that TRX has just completed the fourth sub-wave at 210 satoshis, which also was the high of the first sub-wave.

While the wavelength and duration is slightly irregular, it is extremely similar to the five sub-waves of the first longer-term wave that was completed in September-November 2019.

Using the same Fib ratios, we can presume that the fifth sub-wave will be completed at the 1.618 Fib level of the previous decrease at 285 satoshis around March 11.

Since we believe that the BTC price will be around $10,000, we can use this to make the prediction that the $0.03 area will be reached around the same time.

To conclude the TRX chart shows that the price has completed a bullish reversal pattern and is ready to move upwards. The target for the top of the ensuing upward move is at $0.3 & 285 satoshis, expected to be reached by the middle of March.

The post TRX’s Bullish Reversal Pattern Reaffirms the Bullish Trend appeared first on BeInCrypto.

Similar to Notcoin - TapSwap on Solana Airdrops In 2024

origin »

TRON (TRX) на Currencies.ru

$ 0 (+0.00%)
Объем 24H $0
Изменеия 24h: 0.00 %, 7d: 0.00 %
Cегодня L: $0 - H: $0.1171
Капитализация $0 Rank 99999
Цена в час новости $ 0.0194876 (-100%)

bullish reversal trx price pattern support area

bullish reversal → Результатов: 126


Фото:

Has the New Bitcoin Bull Market Officially Begun?

Bitcoin’s status as an uncorrelated asset makes it extremely difficult to gauge the timing of the market cycle. Its volatility makes it easy for traders to get pump-faked and get liquidated when the market takes an unexpected reversal, so, are we finally in a bull market? Are We in a Bitcoin Bull Market? Benjamin Cowen, a trader who goes by intothecryptoverse on Twitter, has released a video where he addresses Bitcoin’s recent bullish price actionRead More

2020-2-16 19:00


These 3 Reasons Are Why Bitcoin’s Price May Soon Explode Past $10,000

Over the past month, Bitcoin (BTC) has absolutely exploded higher. In fact, the cryptocurrency is up around 40% since the low of $6,400 put in during December of last year. While many analysts have said that this jaw-dropping rally constitutes a macro reversal that will thrust BTC back into a decisively bullish phase, some aren’t... The post appeared first on NewsBTC.

2020-1-22 13:00


This Analysis Suggests Bitcoin’s Price May Plunge 50% to the $3,000s, Again

Over the past month, Bitcoin (BTC) has absolutely exploded higher. In fact, the cryptocurrency is up around 40% since the low of $6,400 put in during December of last year. While many analysts have said that this jaw-dropping rally constitutes a macro reversal that will thrust BTC back into a decisively bullish phase, an analysis... The post appeared first on NewsBTC.

2020-1-20 03:45


Bitcoin Poised to Collapse Under $5,000? Market Cycle Fractal Suggests So

Over the past few weeks, Bitcoin (BTC) has found itself consolidating in the low-$7,000s, holding this key support region as bears threaten the cryptocurrency’s demise. While this consolidation has been bullish, in that selling pressure has abated for weeks, setting the stage for a bullish reversal, a market cycle analysis by a popular crypto trader.

2019-12-15 23:49


Santander Exec Praises Blockchain Tech After $20M Ethereum-Issued Bond Redemption

Santander, the Spanish banking group, recently became the subject of a Whale Alert tweet as they redeemed their first blockchain bond on the Ethereum ledger, worth $99,000. With this announcement, there are many cryptocurrency proponents that seem optimistic about the direction of Ethereum’s price, pushing for a bullish reversal. While that reversal has yet to […]

2019-12-11 23:33


Tezos Price Analysis: Continuous Growth

Tezos has a bullish short-term and medium-term trading outlook The four-hour time frame shows that a bearish reversal may start to take place The daily time frame continues to show the presence of a large bullish pattern   Tezos is starting to correct lower after the cryptocurrency recently rallied to its highest trading level since […] The post Tezos Price Analysis: Continuous Growth appeared first on Crypto Briefing.

2019-12-11 19:17


Standard Tokenization Protocol Price Analysis: Positive Changes

STPT/USD has a bullish short-term and medium-term trading outlook The four-hour time frame shows that a bullish reversal pattern has formed The daily time frame shows that a bullish double-bottom pattern has formed   Standard Tokenization Protocol is starting to show positive technical signs on both the lower and higher time frames, with the cryptocurrency […] The post Standard Tokenization Protocol Price Analysis: Positive Changes appeared first on Crypto Briefing.

2019-12-9 17:05


Decred Price Analysis DCR / USD: Bullish Reversal

Decred has a bullish short-term and a bearish medium-term trading outlook The four-hour time frame shows that large inverted head and shoulders pattern has formed The daily time frame shows a large descending triangle pattern Decred has been on the rise since Chinese President Xi Jinping’s positive comments towards blockchain and cryptocurrencies, with the DCR […] The post Decred Price Analysis DCR / USD: Bullish Reversal appeared first on Crypto Briefing.

2019-11-11 18:52