2022-5-19 15:30 |
Be[in]Crypto takes a look at the price movement for seven different cryptocurrencies, including Tron (TRX), which has broken out from a 10-day consolidation pattern.
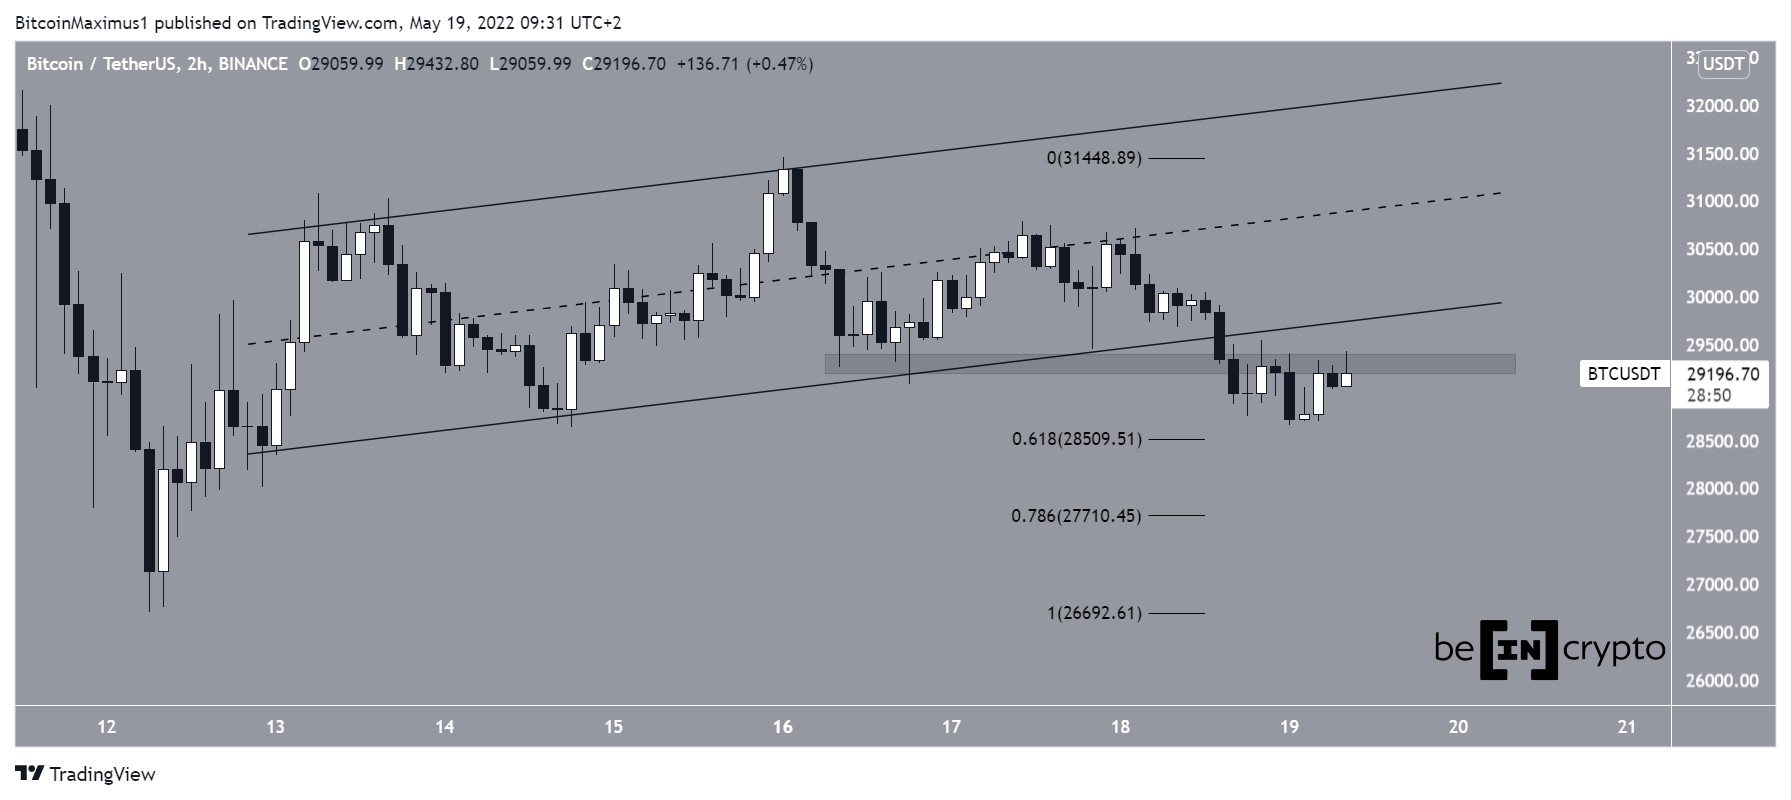
BTCBitcoin (BTC) had been trading inside an ascending parallel channel since May 11. It broke down from the channel on May 18 and proceeded to reach a low of $28,654 the next day.
The price bounced at the 0.618 Fib retracement level and initiated an upward movement soon afterward. Despite the bounce, BTC is facing resistance from the $29,300 horizontal area.
BTC/USDT Chart By TradingView ETHEthereum (ETH) had been increasing alongside an ascending support line since May 12. Similar to BTC, it broke down from the line on May 18. It is currently trading inside the $1,920 horizontal support area, where it has bounced. This is the final support level prior to the May 12 lows.
ETH/USDT Chart By TradingView XRPXRP has been decreasing underneath a descending resistance line since May 13. More recently, it was rejected by the line on May 18 (red icon). When combined with the $0.40 horizontal area, this created a descending triangle, which is considered a bearish pattern.
If XRP were to break down from this area, the next closest support would be at the May 12 lows at $0.34.
XRP/USDT Chart By TradingView RUNETHORChain (RUNE) has been falling since May 16, when it was trading at a high of $3.82. The downward movement led to a low of $2.87 on May 19.
While the price has bounced since, it failed to reclaim the $3 horizontal area (red icon), which previously acted as support. The area is now expected to provide resistance.
RUNE/USDT Chart By TradingView TRXTRON (TRX) had been trading inside a symmetrical triangle since May 11. The symmetrical triangle is considered a neutral pattern, meaning that both a breakout and a breakdown could occur.
The price managed to break out on May 19, in a movement that is still ongoing.
If the upward movement continues, the closest resistance area would be at $0.076.
TRX/USDT Chart By TradingView EGLDElrond (EGLD) had been increasing inside an ascending support line since May 12. The price finally broke down from the line on May 18 and proceeded to reach a low of $87.38 on May 19.
If the downward movement continues, the closest support area would be at $84. This is the 0.618 Fib retracement support level.
EGLD/USDT Chart By TradingView FTTFTX (FTT) has been falling since reaching a high of $53.34 on March 28. The downward movement led to a low of $25.10 on May 12. This was a new yearly low.
FTT has bounced since but was rejected by the $32.80 area, which had previously acted as support (red icon). This is a crucial support area since it was the previous yearly low.
Until the price manages to reclaim it, the trend cannot be considered bullish.
FTT/USD Chart By TradingViewFor Be[in]Crypto’s latest Bitcoin (BTC) analysis, click here
The post Tron (TRX) Breaks out From Consolidation Pattern: Multi-Coin Analysis appeared first on BeInCrypto.
origin »Bitcoin price in Telegram @btc_price_every_hour
TRON (TRX) на Currencies.ru
|
|