2020-9-29 13:15 |
The Tomochain (TOMO) price began a bounce on Sept 5 which is still ongoing. While the price is expected to move upwards in the short and medium-term, the direction of the longer-term trend still seems to be bearish.
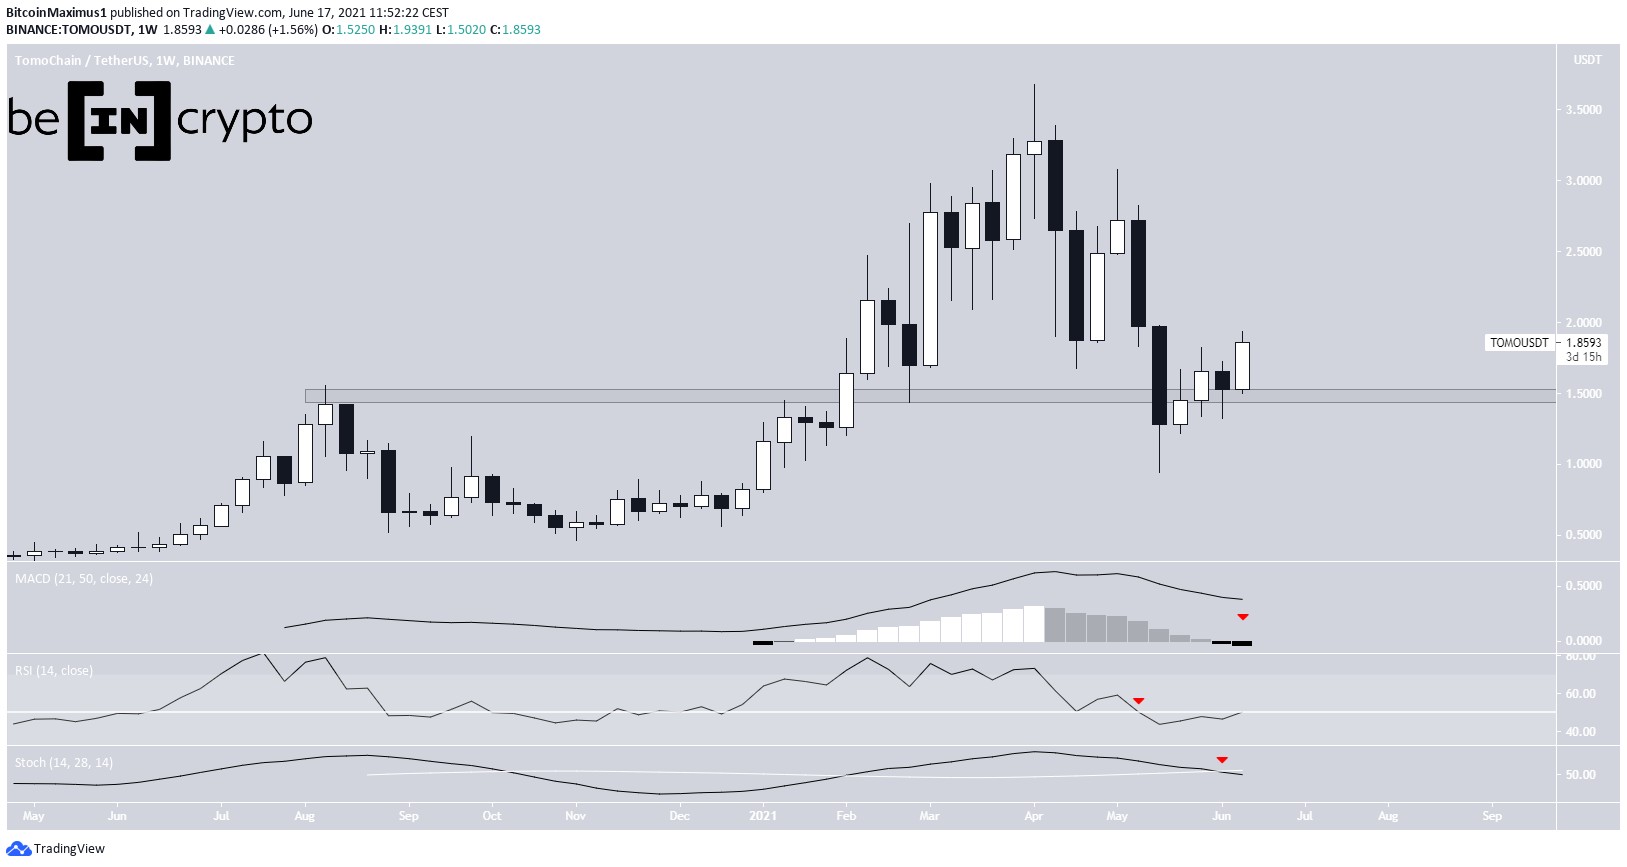
The TOMO price has been decreasing since reaching a high of $1.55 on Aug 13. The decrease that followed has been swift, and the price reached a new local low of $0.52 on Sept 5. TOMO has since recovered from this low and is currently trading at $0.78.
TOMO Returns to Average Long-Term LevelsThe low validated both the $0.62 support area and the ascending support line that has been in place since the March 13 bottom. On Sept 25, TOMO was able to briefly reach $0.975 before being rejected.
Therefore, the price is currently trading in a range between the support line near $0.62 and the resistance area of $0.96.
TOMO Chart By TradingViewCryptocurrency trader @devchart outlined a TOMO price chart showing that the price has increased by 10% since his last update. Dev predicts that this momentum will continue increasing to push TOMO to the $1.10 level.
Source: Twitter Upward TrendTechnical indicators on the daily time-frame are bullish:
The MACD is moving upwards and has almost crossed into positive territory. The Stochastic Oscillator has made a bullish cross and is moving upwards. The RSI is above 50.Furthermore, the price has broken out from a descending resistance line, suggesting that an upward trend has begun.
TOMO Chart By TradingViewThe shorter-term 6-hour chart suggests that a retracement is expected before the price resumes its upward movement, however.
TOMO was rejected by the 0.618 Fib level of the previous decrease on Sept 24. It managed to bounce inside a minor support area between $0.66-$0.73 (0.618-0.786 Fib levels). This zone also coincides with a possible ascending support line drawn from the aforementioned Sept 5 low.
Technical indicators have not yet given any reversal signs, making it likely that TOMO will drop back inside this area.
A decrease below $0.61 (red line) would likely invalidate this bullish prospect.
TOMO Chart By TradingView Wave CountBeginning on Aug 13, it is possible that TOMO has begun a corrective A-B-C formation (shown in orange below).
The fact that we can outline five sub-waves (red) for both A and C waves and that their ratio is 1:1 makes this likely to be the correct count.
TOMO Chart By TradingViewHowever, the movement since the low seems corrective rather than impulsive. Up to this point, the price has likely completed two minor A-B-C formations in which the A and C waves had ratios of 1:1.27 and 1:1.61, respectively.
This makes it probable that the current movement is a correction rather than the beginning of a new upward movement.
TOMO Chart By TradingViewIf so, we would expect the price to increase towards $1.15-$1.32, the 0.618-0.786 Fib levels of the previous decrease, before possibly resuming its downward trend once more.
TOMO Chart By TradingViewTo conclude, while the TOMO price is expected to continue moving upwards, it is likely that the longer-term trend is still bearish.
For BeInCrypto’s latest Bitcoin (BTC) analysis, click here!
The post TOMO Charges Up for Another Attack on $1 Resistance Level appeared first on BeInCrypto.
origin »Bitcoin price in Telegram @btc_price_every_hour
ETH/LINK Price Action Candlestick Set (LINKETHPA) на Currencies.ru
|
|