2024-2-29 21:30 |
Just yesterday, BeInCrypto reported that 2 on-chain indicators suggest the start of a mature phase of the bull market. However, today, another indicator, the MVRV Z-Score, enters a historically very important area, which has been associated with an inevitable correction of the BTC price in every previous cycle.
If Bitcoin’s current cycle “rhymes” with previous ones, the price of the largest cryptocurrency could soon drop by 47%. This would involve a retest of the $32,000 area, the validation of which would be a very bullish event from a technical perspective.
Is the Bitcoin and cryptocurrency market ready for a correction? Or will Bitcoin reach a new all-time high (ATH) for the first time, fueled by the energy of institutional adoption and spot ETFs, even before the April halving?
MVRV Z-Score Signals Impending CorrectionMVRV is otherwise known as the Market Value to Realized Value ratio. It is a long-term indicator of the Bitcoin market. Moreover, it gives an indication of when the price is below the so-called “fair value.”
Meanwhile, its derivative, MVRV Z-Score, assesses when Bitcoin is overvalued/undervalued relative to its “fair value.” The addition here is the standard deviation of all historical market capitalization data.
Typically, the MVRV Z-Score moves in three ranges. Sometimes, however, it briefly moves out of them in extreme bull or bear market end conditions:
green area between 0 and -0.5: interpreted as an indicator of BTC price below “fair value” area between 0 and 7: neutral range of “fair value” the red area between 7 and 9 is interpreted as the BTC price index above “fair value”Read More: Bitcoin Price Prediction 2024/2025/2030
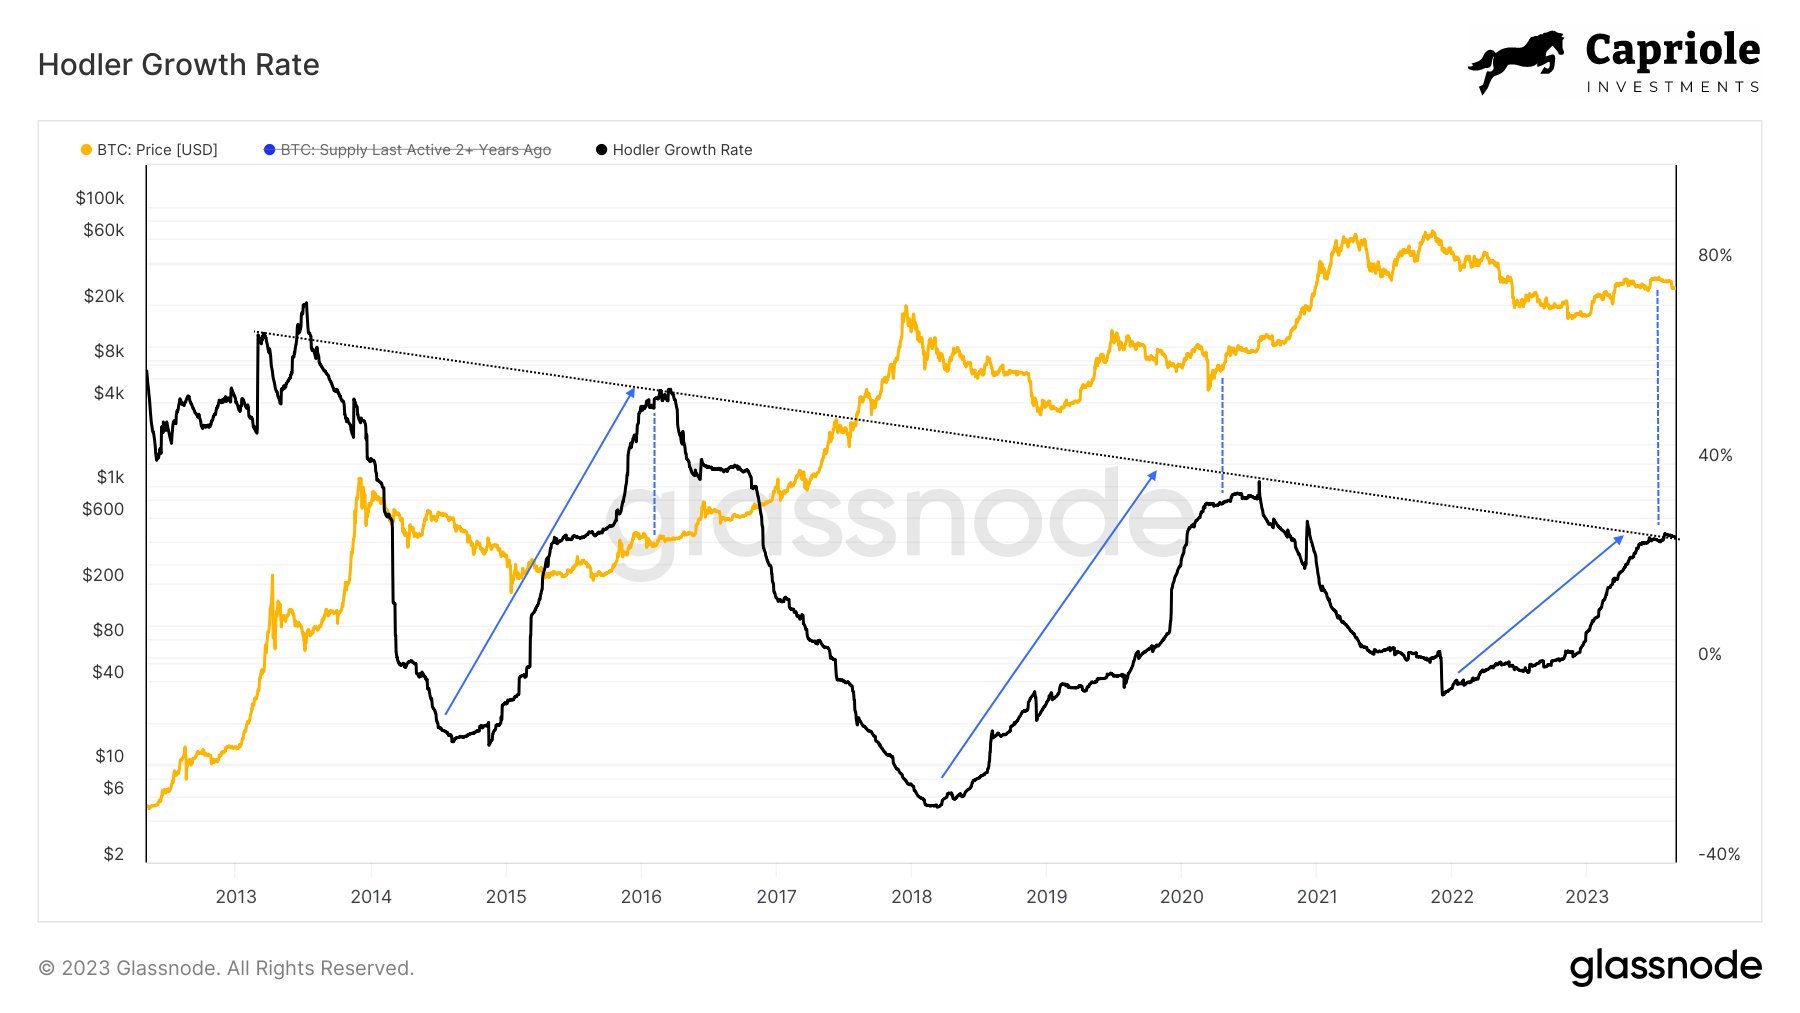
In the chart below, we notice that the MVRV Z-Score has currently entered area 2 (blue). This is happening for the first time in this cycle. Moreover, in all previous cycles, the first reaching of this area (yellow circles) was associated with an imminent correction of the BTC price (yellow rectangles).
MVRV Z-Score chart by GlassnodeAfter correcting the BTC price and the indicator’s decline, both charts generated higher lows and continued to climb. If a similar situation happens this time, the next 6 months or so could be a period of accumulation in the Bitcoin market. It is worth adding that such accumulation could be an excellent opportunity for the growth of other cryptocurrencies and the start of the long-awaited altcoin season.
The reaching of this important area by the MVRV Z-Score was also noted by the well-known analyst @PositiveCrypto. However, he ties this area to a bullish bias, suggesting that the Bitcoin market is still far from overheating.
“Still a long way to go before this cycle becomes overheated though. HODL” PositiveCrypto stated.
1/ #bitcoin MVRV Z-Score is now scoring +2 for the first time this bull cycle.
Still a long way to go before this cycle becomes overheated though.
HODL. pic.twitter.com/JfsQ45VJHB
Counting the depth of historical corrections and determining the area of support to which the BTC price could plunge is now possible. On the long-term chart, plot the declines that occurred after the MVRV Z-Score first reached the 2 area.
It turns out that the correction was quite deep each time: 50% in 2012, 38% in 2016, and 53% in 2020. Thus, in the three previous cycles, the average was 47%.
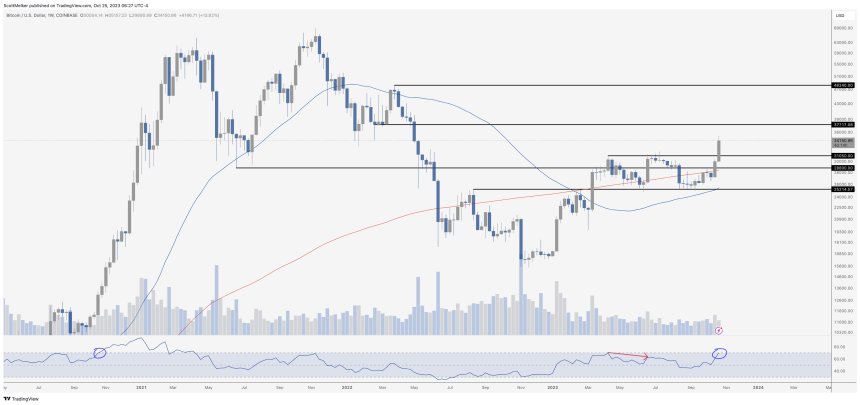
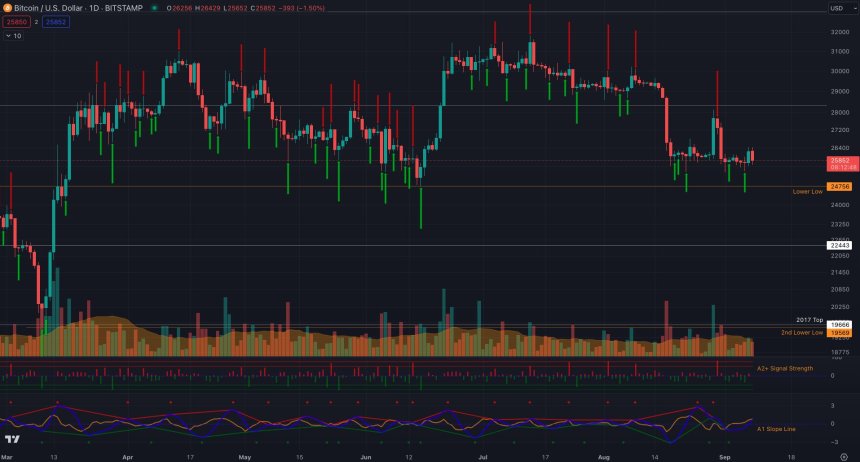
BTC/USD chart by TradingviewIf one were to superimpose a potential correction of the BTC price on the current chart, interesting technical correlations appear. A 47% drop in Bitcoin from the current $59,000 area would lead to support near $32,000 (green line).
First, this area is located almost exactly at the key 0.618 Fib retracement of the entire upward movement from the lows of the current cycle. This retracement is a common target for deepening corrections in financial markets.
Read More: 10 Best Crypto Exchanges and Apps for Beginners in 2024
Next, the $32,000 level has repeatedly acted as macro support and resistance since 2021 (blue arrows). In October 2023, the BTC price decisively broke out above this area (blue circle). However, since then, it has not led to its bullish validation as support.
BTC/USD chart by TradingviewIf the Bitcoin market were to undergo a long-awaited correction in the next 6 months, the $32,000 level would be an excellent buying area. Both technical correlations and the on-chain MVRV Z-Score indicate it.
For BeInCrypto’s latest crypto market analysis, click here.
The post This Indicator Suggests a 47% Correction for Bitcoin (BTC) to $32,000 appeared first on BeInCrypto.
origin »Bitcoin price in Telegram @btc_price_every_hour
Bitcoin (BTC) на Currencies.ru
|
|