2020-5-22 23:00 |
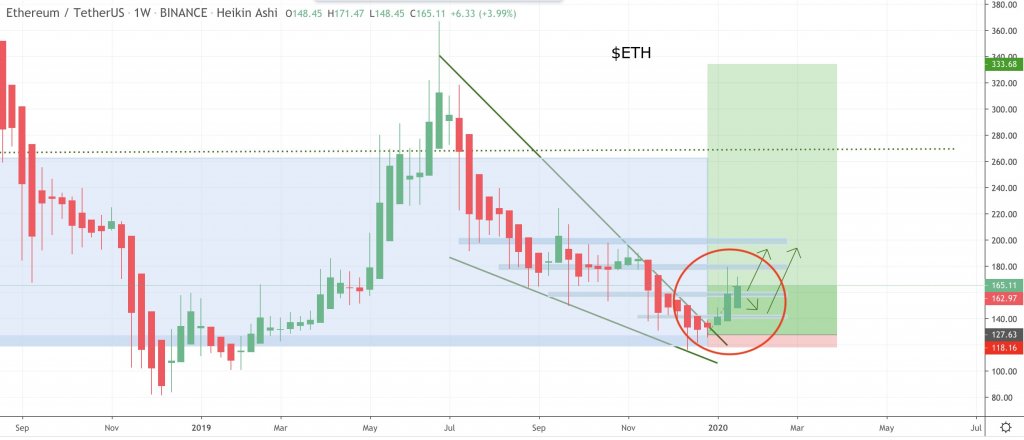
XRP has been largely hovering around the $0.20 region in recent times, failing to garner any decisive momentum as the aggregated market stalls The crypto’s lack of growth in recent times has led it to surrender its spot as the third largest digital asset to stablecoin Tether (USDT) One analyst is now pointing to a grim fractal pattern that shows the cryptocurrency could be at grave risk of seeing a massive downside movement in the days and weeks ahead XRP is now the fourth largest cryptocurrency by market cap, with its lackluster price action causing it to be surpassed by Tether (USDT). The growth of Tether’s market cap has largely come about as the result of the stablecoin seeing massive buying pressure from countries like China. Investors are using it to give their portfolios exposure to the US Dollar during these unstable times. It does appear that XRP may continue losing its market share, however, as analysts are now pointing to one strikingly bearish fractal pattern. If this pattern plays out, the embattled token could soon see a capitulatory decline that leads it back down to its yearly lows. XRP Enters Firm Consolidation Phase as it Hovers Above Massive Support Level At the time of writing, XRP is trading down just over 3% at its current price of $0.199, marking a slight decline from daily highs of just under $0.21. It has been able to gain some ground against Bitcoin today, however, as it is currently trading up 3% against the benchmark digital asset. This climb against BTC has largely been rooted in the weakness the benchmark crypto expressed yesterday after a Satoshi-era wallet moved 50 BTC. Its news-related decline allowed most altcoins to outperform it. One factor to be aware of in the near-term is that XRP is trading just a hair above a massive support level. A respected pseudonymous trader had previously noted that a continued defense of the support existing in the region surrounding 0.0002 BTC could be enough to propel it higher. “XRP I’m expecting a significant bounce somewhere in green. I’d argue XRP is probably a not so terrible buy already but given the fact that it hitting the lower boundary of the support outlined is very possible I’m playing defensive for now.” Image Courtesy of DonAlt This Fractal Spells Trouble for the Cryptocurrency One recently emerged fractal pattern that investors have been pointing to shows that XRP’s recent price action is strikingly similar to that seen in early-2019, just before it posted an over 50% decline against its BTC trading pair. Another popular trader compared the price action seen then with that seen now in the chart seen below. Image Courtesy of il Capo Of Crypto In early-May, the same analyst noted that he believes XRP could continue declining against its USD trading pair until it reaches $0.05. Featured image from Shutterstock. origin »
Bitcoin price in Telegram @btc_price_every_hour
Ripple (XRP) на Currencies.ru
|
|