2023-10-6 21:00 |
On-chain data shows the Ethereum MVRV ratio is currently testing a level that has historically served as the boundary between bear and bull markets.
Ethereum MVRV Ratio Is Retesting Its 180-Day SMA Right NowThe “Market Value to Realized Value (MVRV) ratio” is an indicator that measures the ratio between the Ethereum market cap and realized cap. The former is naturally just the total supply valuation at its spot price. At the same time, the latter is an on-chain capitalization model that calculates the value differently.
The realized cap assumes that the real value of any coin in circulation isn’t the spot price (which the market cap refers to) but the price at which it was last bought/transferred on the blockchain.
One way to look at the realized cap is that it represents the total amount of capital that the investors have put into the cryptocurrency, as it considers each holder’s cost basis or buying price.
Since the MVRV ratio compares these two capitalization models, it can tell us whether the investors hold more or less value than they initially invested in Ethereum.
The indicator’s usefulness is that it may serve as a way to determine whether the asset’s price is fair or not right now. When the investors hold a value significantly more than they put in (that is, they are in high profits), they would be more tempted to sell, and hence, the spot price could face a correction.
Similarly, the holders as a whole being in deep losses can instead be a signal that the bottom might be near for the cryptocurrency, as it’s becoming quite underpriced.
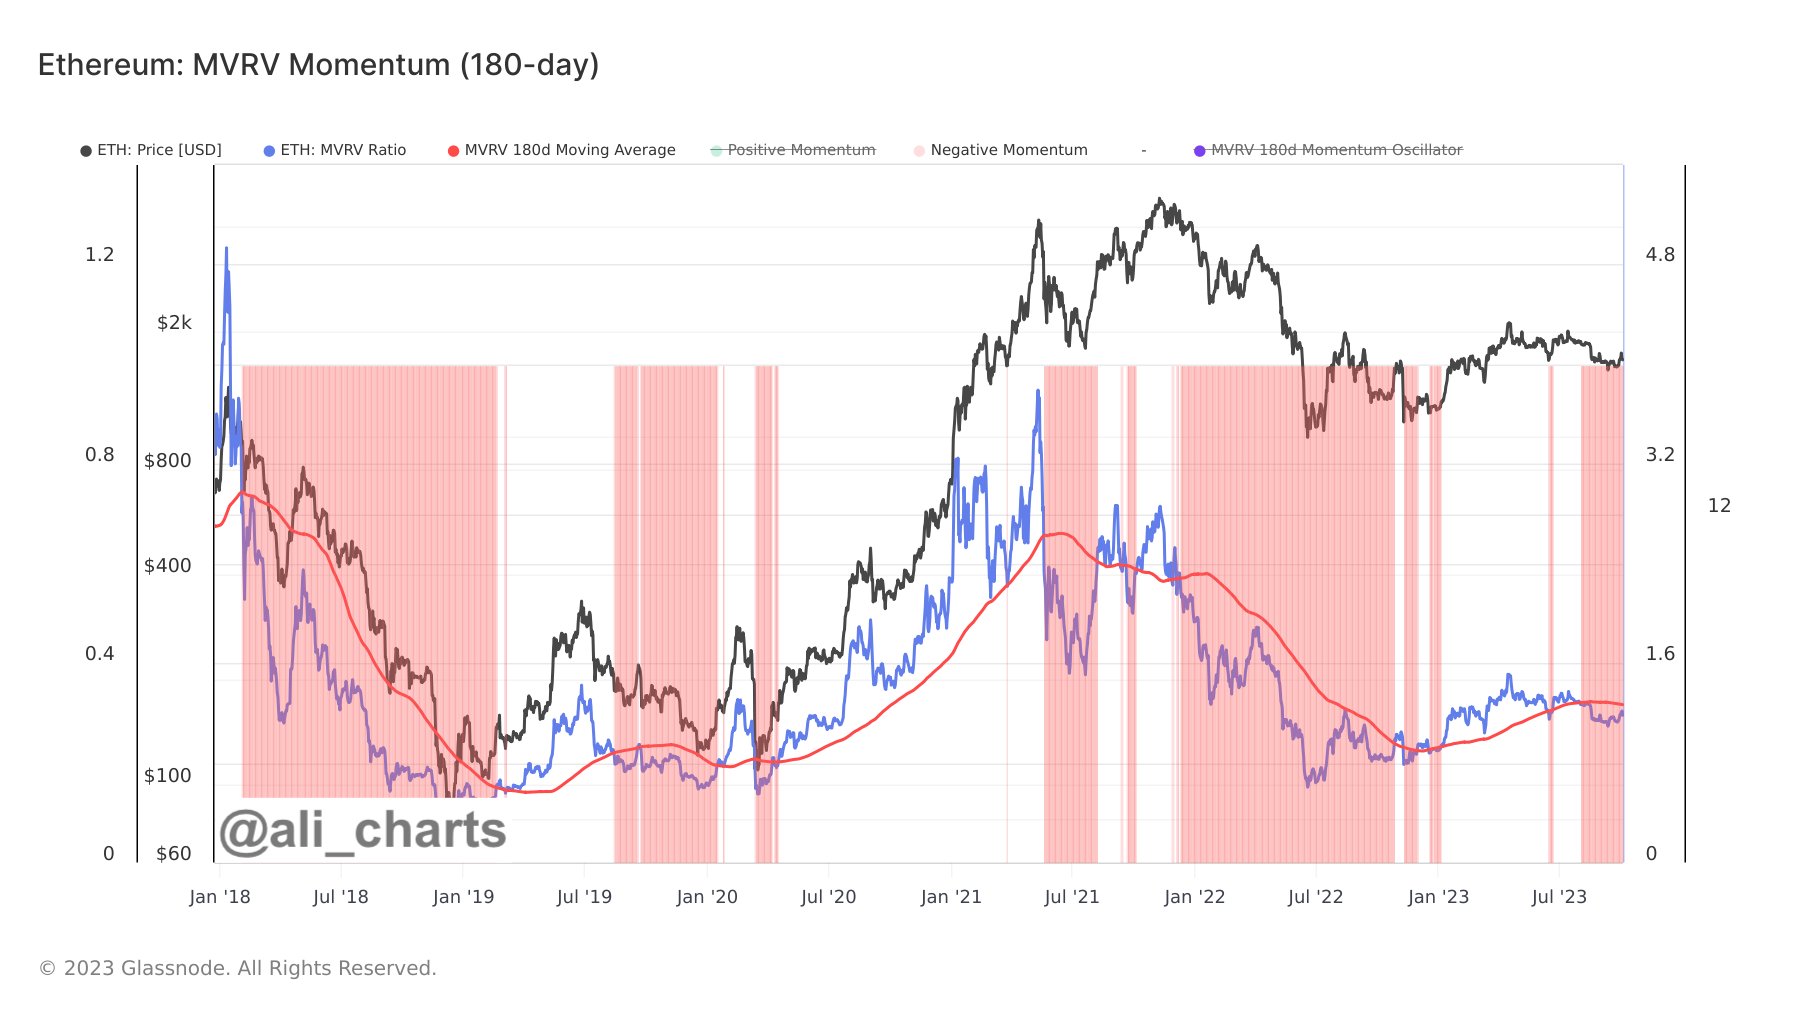
Now, here is a chart shared by analyst Ali on X, which shows the trend in the Ethereum MVRV ratio, as well as its 180-day simple moving average (SMA), over the past few years:
The 180-day SMA of the ETH MVRV ratio has interestingly held significance for the cryptocurrency. According to Ali, “Ethereum market cycles transition from bearish to bullish when the MVRV (blue line) breaks strongly above the MVRV 180-day SMA (red line).”
During the bear market last year, the ratio had been below the 180-day SMA line, but with the rally that began this year in January, the metric had managed to break above the level, and bullish winds supported the asset once more. During the recent struggle for the asset, however, the MVRV has again slipped under the level.
Nonetheless, in the past few days, the ETH MVRV has been trending up a bit and approaching another retest of this historical junction between bearish and bullish trends.
It remains to be seen whether a retest will happen in the coming days for Ethereum and if a break towards the bullish territory can be found.
ETH Price origin »Bitcoin price in Telegram @btc_price_every_hour
Ratio (RATIO) на Currencies.ru
|
|