2025-2-17 18:00 |
Injective is showing strong price action as it gains momentum in the market. The token has surged over 7% today, with trading volume increasing by 46%, indicating heightened investor interest. Top analyst DevKhabib shared on X (formerly Twitter) that INJ’s price is showing strength, unlike the rest of the market.
His analysis suggests a symmetrical triangle pattern has formed on the INJ price chart, signaling a potential breakout. Meanwhile, noise around the asset has intensified, with traders discussing the possibility of INJ surpassing $20 soon.
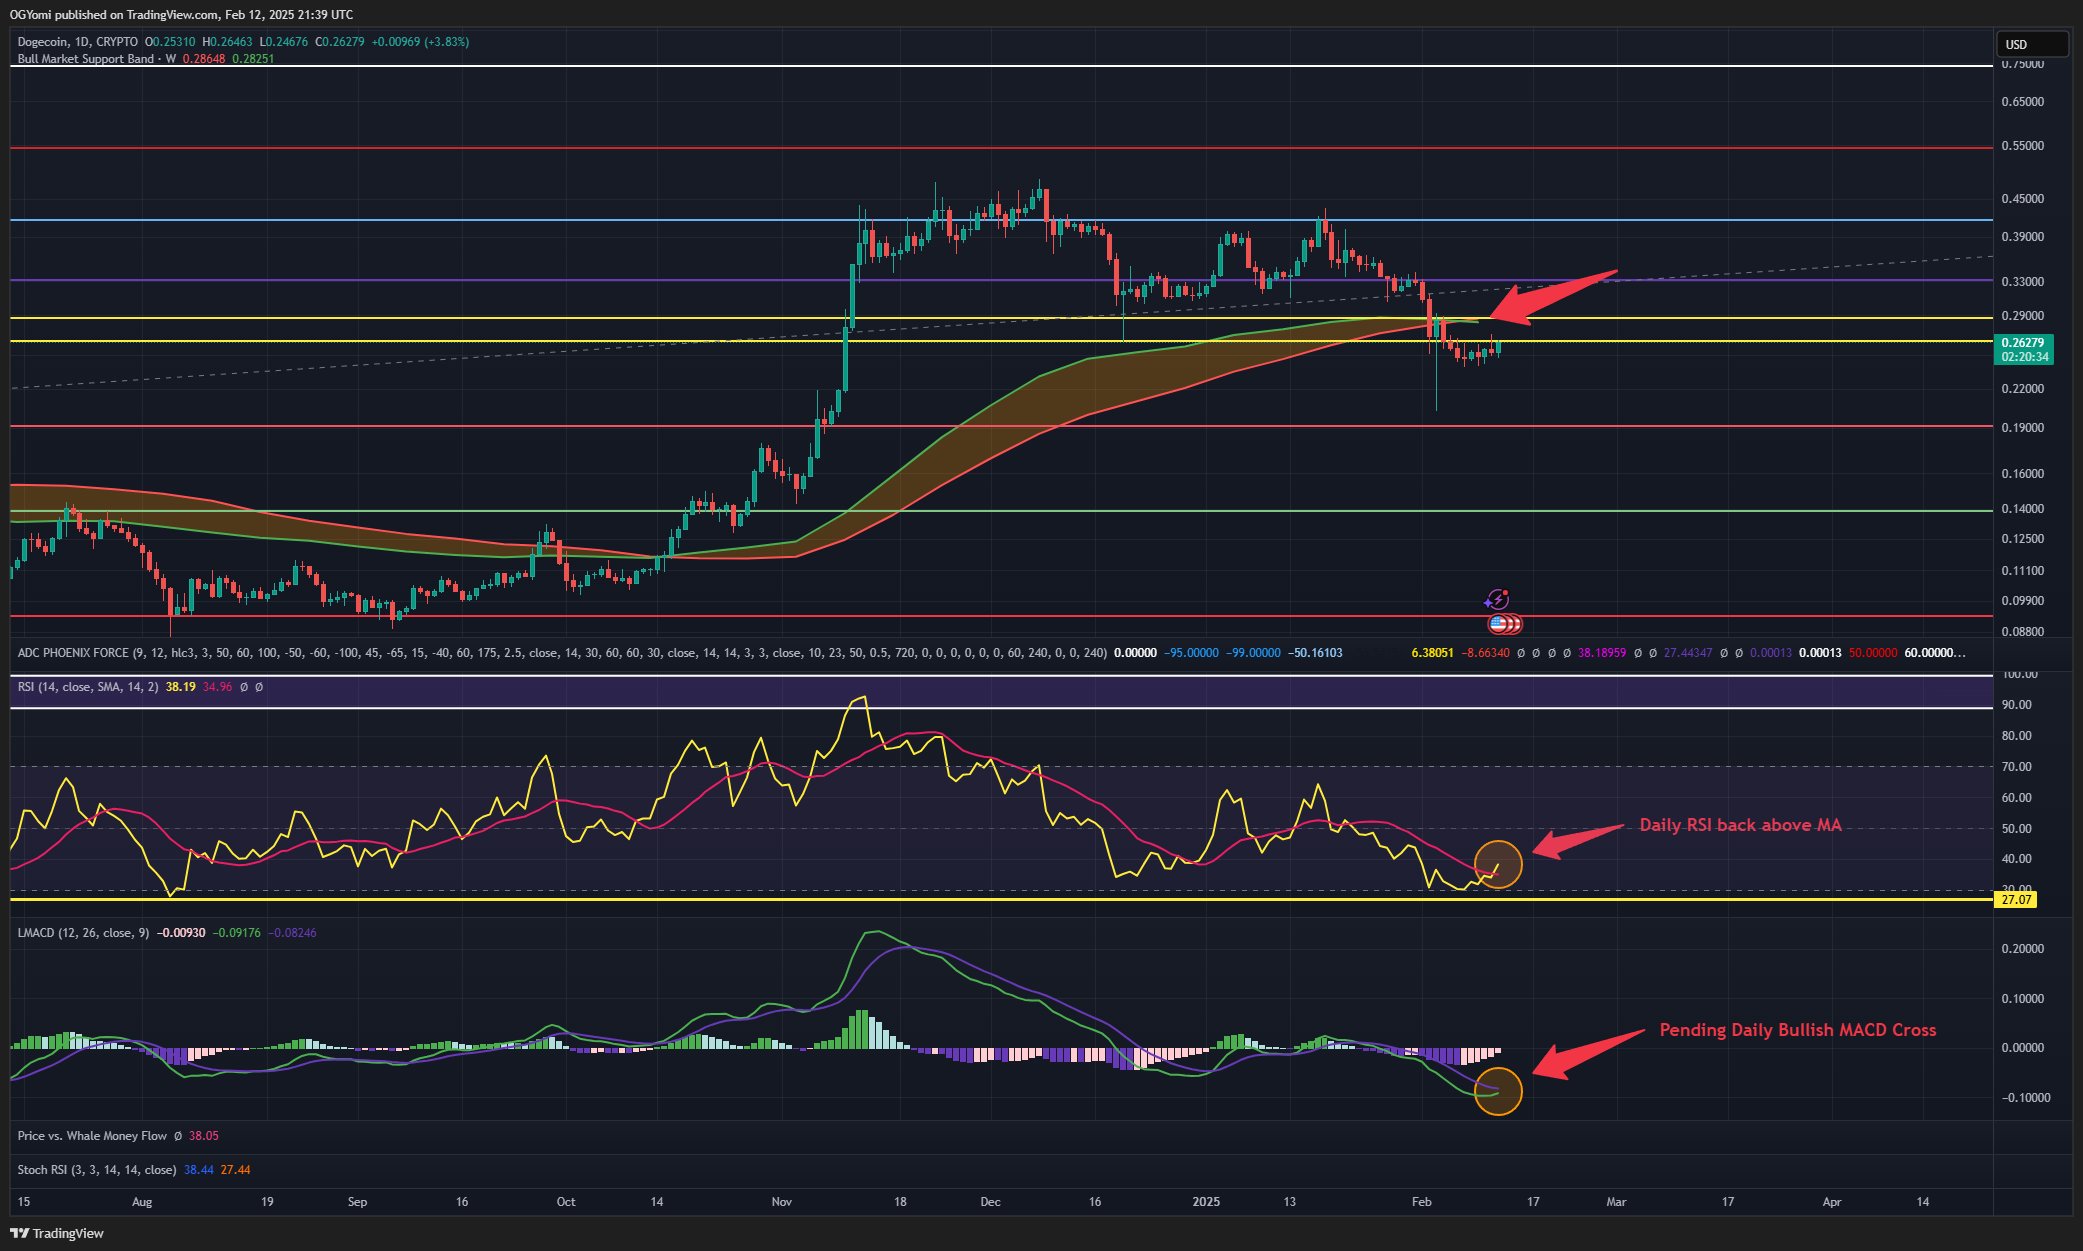
Injective Chart AnalysisThe current price structure shows a symmetrical triangle pattern, often associated with periods of consolidation before a breakout. The price of INJ has been making higher lows while facing resistance at the upper boundary of the formation. This pattern suggests that market participants are accumulating INJ, waiting for a directional move.
Key support remains at $14.00, where the price has consistently found buying interest. On the resistance side, the $15.00-$15.50 range is an immediate hurdle. A breakout above this level could open the path to $18.50-$19.00, with $20.00 standing as a psychological resistance level. If the pattern holds, a strong upward move may be imminent.
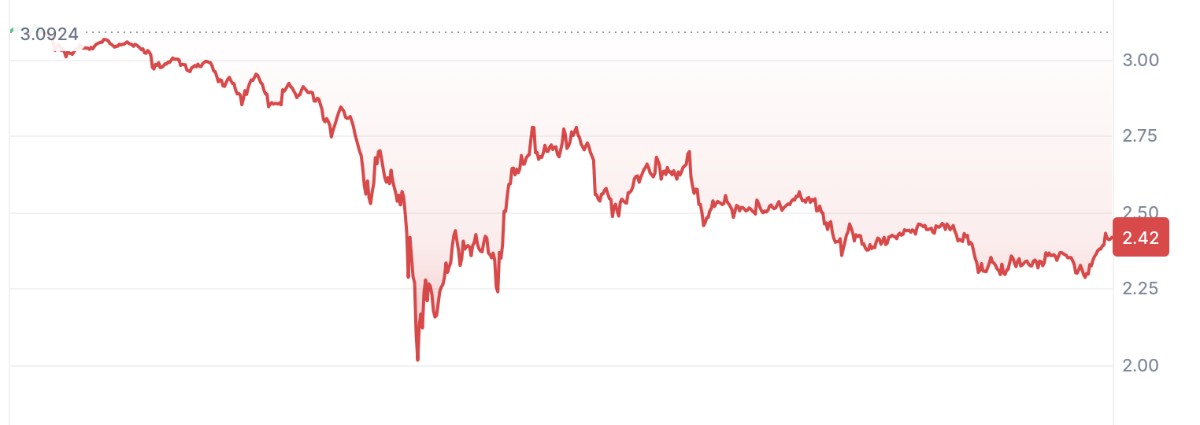
Image Source: X/DevKhabib Injective Market Strength and Social SentimentThe current price movement stands out against a weaker broader market. Crypto trader DevKhabib highlighted INJ’s resilience, stating, “$INJ looks ready! It is showing strength, unlike the rest of the market. I can see it teleporting back above $20 soon.” This suggests a growing confidence among traders that the token could outperform in the coming days.
Relative strength in a weak market often signals sustained demand. If INJ’s price continues to trade with bullish momentum while other assets lag, it could indicate a shift in sentiment favoring the token.
Read Also: XRP Price Prediction as Elon Musk & Ripple Partnership Rumors Spread – Best Altcoin to Buy Now?
INJ Key Levels and Risk ConsiderationsIf the price pushes above $15.50-$16.00 with heavy trading, we could see it climb toward $20. But if it can’t break through that ceiling, expect it to fall back and test $14.00. A drop below $14.00 could send the price even lower.
Keep an eye on trading volume; it must be strong for any real price movement. Weak volume usually means the price movement won’t stick. The next few trading sessions should give us a better idea of where INJ’s price is heading. With rising trading activity and a bullish setup forming, INJ remains a token to watch closely.
Follow us on X (Twitter), CoinMarketCap and Binance Square for more daily crypto updates.
Get all our future calls by joining our FREE Telegram group.
Wide range of assets: cryptocurrencies alongside other investment products such as stocks and ETFs.
Copy trading: allows users to copy the trades of leading traders, for free.
User-friendly: eToro’s web-based platform and mobile app are user-friendly and easy to navigate.
The post This Chart Pattern Suggests Injective (INJ) May Be Gearing Up for a Rally – Here’s Why appeared first on CaptainAltcoin.
origin »Bitcoin price in Telegram @btc_price_every_hour
Injective Protocol (INJ) на Currencies.ru
|
|