2021-11-17 14:47 |
BeInCrypto takes a look at the price movement for seven different cryptocurrencies, including The Sandbox (SAND). Despite the token reaching a new all-time high price, it has fallen back to an important support/resistance level.
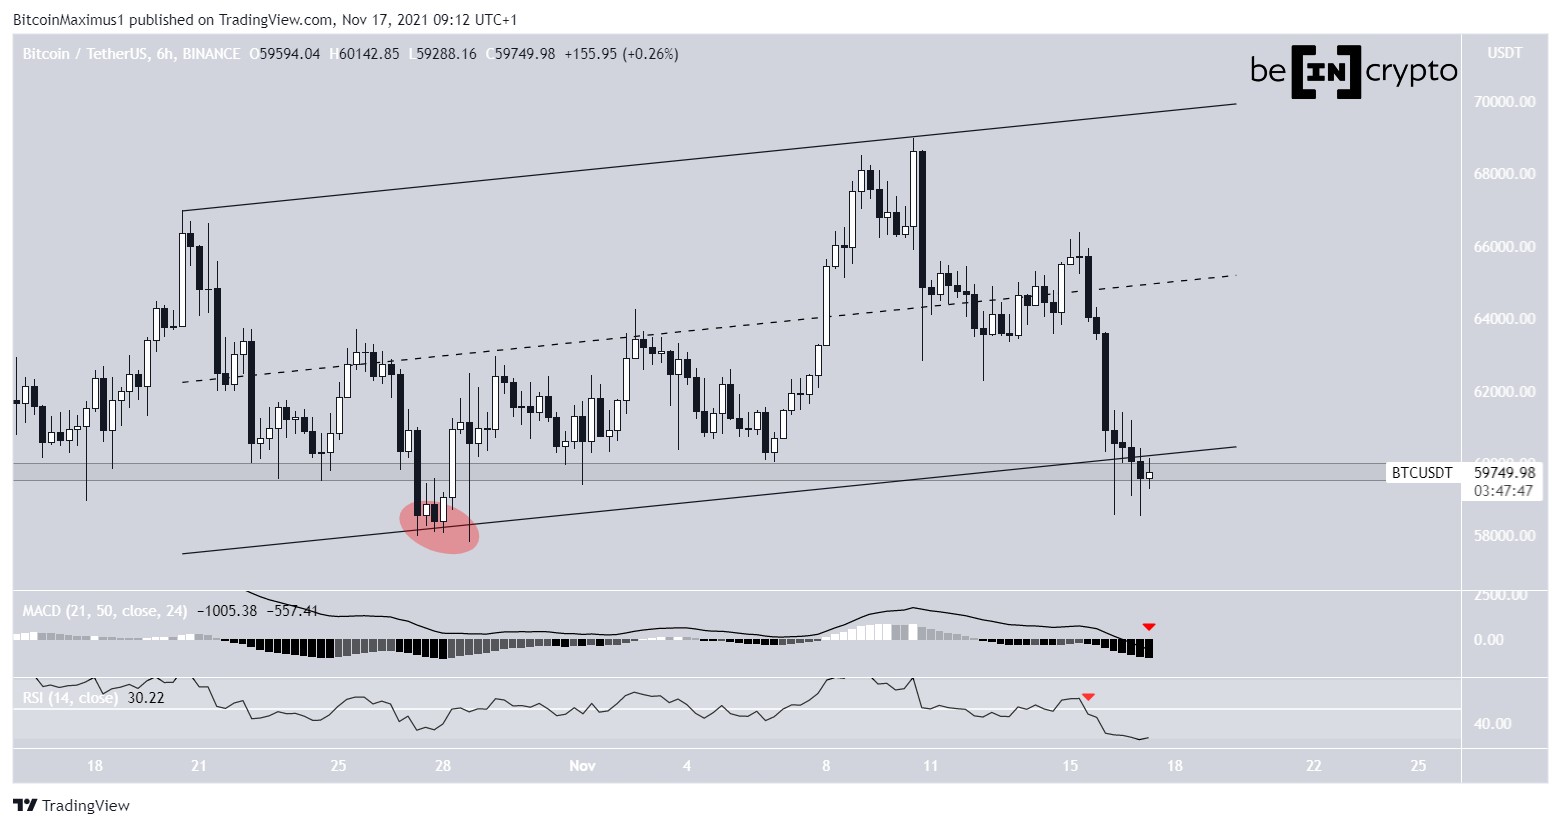
Bitcoin (BTC)BTC has been trading inside an ascending parallel channel since Oct 20. It was recently rejected by its resistance line on Nov 10 and began its current downward move.
On Nov 16, it reached the support line of the channel and the $59,700 support area. It had previously deviated below this area on Oct 27 before reclaiming it.
The MACD and RSI are both decreasing (red icons), supporting the continuation of the downward movement.
However, a short-term bounce could occur prior to the price falling below support.
BTC Chart By TradingView Ethereum (ETH)ETH had been moving upwards above an ascending support line since Sept 27. This led to a new all-time high price of $4,864 on Nov 10.
However, it has been decreasing since then and broke down from the ascending support line on Nov 15.
It’s currently trading just above the 0.382 Fib retracement support level at $4,030. If it were to break down, the next major support would be found back at $3,500.
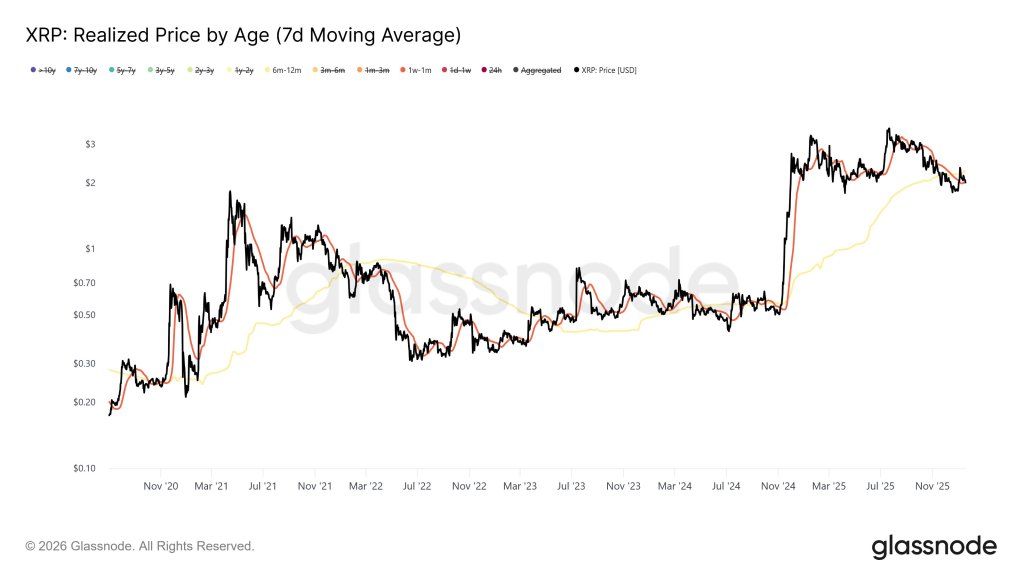
ETH Chart By TradingView XRPOn Nov 7, XRP broke out from the $1.25 horizontal area and reached a high of $1.35 three days later.
However, it fell after this rally and the area failed to act as support. Instead, it turned to resistance again on Nov 15.
XRP also broke down from a short-term ascending support line (dashed) but bounced at a longer-term support (solid). As long as it is trading above this major support, the bullish structure remains intact.
XRP Chart By TradingView The Sandbox (SAND)The Sandbox (SAND) has been increasing above an ascending support line since Nov 10. This led to a new all-time high price of $3.61 on Nov 17.
However, the upward movement could not be sustained and SAND created a long upper wick (red icon). This is considered a sign of selling pressure and caused SAND to fall below the $3.30 horizontal support area, which acts as the all-time high resistance.
If a further rejection occurs, the closest support would be found at $2.60 near the aforementioned ascending support line.
SAND Chart By TradingView IOTAIOTA has been trading in a range between $1.18 and $1.50 since Oct 4. It recently bounced twice at the support of this range (green icons) on Oct 27 and Nov 16. This created long lower wicks, which are normally considered signs of buying pressure.
Currently, IOTA is approaching the resistance area of this range. If it breaks out, the next resistance would be found near the September highs at around $2.
IOTA Chart By TradingView Crypto.com Coin (CRO)Crypto.com Coin (CRO) has been increasing since Sept 29. On Nov 15, it reached a new all-time high price of $0.526. Despite falling back after this, it’s still holding on above the 1.61 external Fib retracement resistance level at $0.39. This area previously acted as resistance and is now expected to act as support.
The next resistance is found at the 2.61 external Fib retracement level near $0.58.
CRO Chart By TradingView Decentraland (MANA)On Nov 16, Decentraland (MANA) bounced at the $2.81 horizontal support area (green icon). This is also the 0.618 Fib retracement support level.
This created a long lower wick as buyers brought the price back up.
MANA is again approaching the $3.60 horizontal resistance area. If it manages to move above it, it could begin to accelerate at a rapid pace.
MANA Chart By TradingViewFor BeInCrypto’s latest Bitcoin (BTC) analysis, click here.
The post The Sandbox (SAND) Reaches New All-Time High — Multi-Coin Analysis appeared first on BeInCrypto.
origin »Bitcoin price in Telegram @btc_price_every_hour
BeachCoin (SAND) на Currencies.ru
|
|