2020-9-20 04:00 |
Bitcoin’s price has been slipping lower over recent days and weeks. From the recent highs set just two days ago, BTC is down by around 2-3%. From the year-to-date highs set two weeks ago, Bitcoin has shed closer to 20%. The cryptocurrency may be primed to return higher as an on-chain metric falls to important levels. The last time this specific metric was this low, the coin surged around 150% in the weeks following the signal. Bitcoin may also gain strength due to fundamental trends as well, such as statements from the Federal Reserve implying continued stimulus. Critical On-Chain Signal Forms Positive Signal Despite Price Weakness
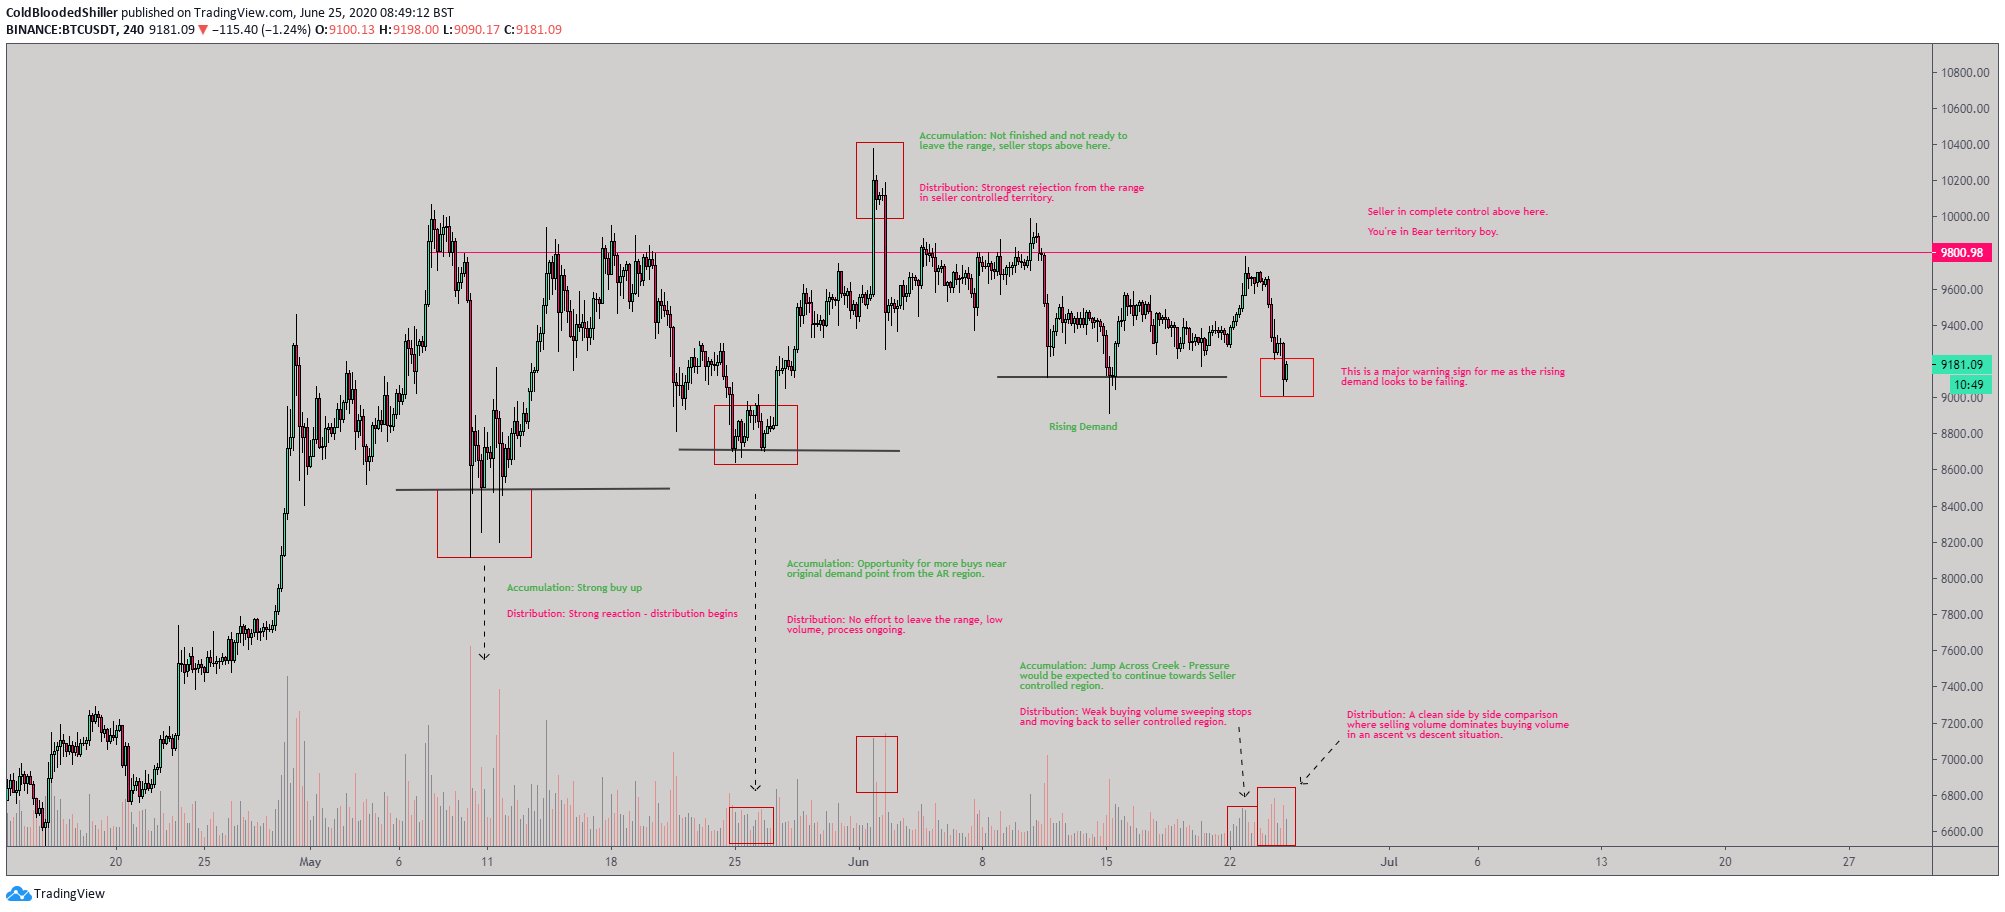
Bitcoin’s trend has been weak over the past few days as the cryptocurrency underwent a critical rejection at the $11,000 price point.
On a long-term time frame, though, bulls remain in control according to a recent analysis by CryptoQuant CEO Ki Young Ju.
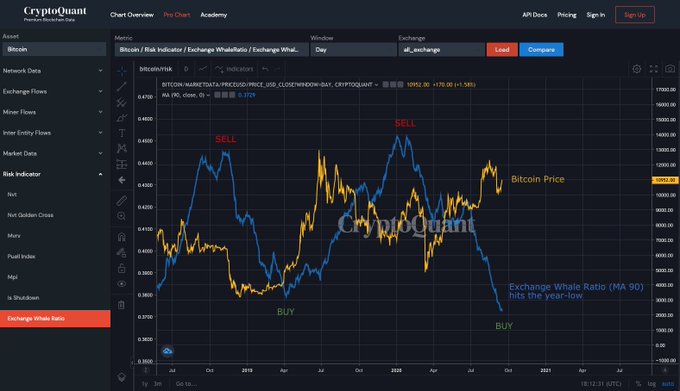
The on-chain analyst shared the chart below on September 17th, showing that the “Exchange Whale Ratio” has hit a yearly low. The metric, which tracks the number of whale-owned BTC being sent to exchanges compared to retail inflows, has hit lows not seen in many years.
The last time that this metric was remotely this level, Bitcoin surged from the $5,000s to $14,000 in the span of three months. BTC doing the same here would mean it sets a new all-time high closer to $30,000 by the end of the year.
Commenting on the significance of this indicator, Ki Young Ju wrote:
“Exchange Whale Ratio hits the year low—the fewer whales moving to exchanges, the less dumping, and makes the higher #BTC price. Exchange Whale Ratio is the relative size of the top 10 inflows to total inflows by day of each exchange. I used the weighted average for all exchanges.”
Chart of BTC's price action over the past two years with whale on-chain analysis by Ki Young Ju, CEO of CryptoQuant. Chart from CryptoQuant. Macro Bull Trend Soon to BeginThis comes shortly after CryptoQuant released an extensive analysis indicating that almost all long-term on-chain signals currently suggest Bitcoin is in a bullish state.
As reported by Bitcoinist previously, the blockchain analytics firm highlighted the following ten indicators, showing that they are printing “buy” signals on a long-term time frame:
Miners’ Position Index Puell Multiple Hash Ribbons All Exchanges Outflow Mean All Exchanges Reserve Stablecoin Supply Ratio All Exchanges Stablecoin Reserve MVRV Ratio Network Value to Metcalfe Ratio Stock to FlowThese signals suggest that now is a good long-term entry into the Bitcoin market despite the recent rejection at the $12,000 resistance.
Long-term $BTC on-chain indicators look healthyhttps://t.co/VnrIVP3lDF pic.twitter.com/cfE73acVXh
— CryptoQuant (@cryptoquant_com) September 16, 2020
Featured Image from Shutterstock Price tags: xbtusd, btcusd, btcusdt Charts from TradingView.com The Last Time This On-Chain Metric Was This Low, Bitcoin Surged 150% origin »Bitcoin price in Telegram @btc_price_every_hour
Bitcoin (BTC) на Currencies.ru
|
|