2021-12-30 09:02 |
Terra (LUNA) has potentially completed a market cycle with its Dec 27 all-time high price slightly above $100.
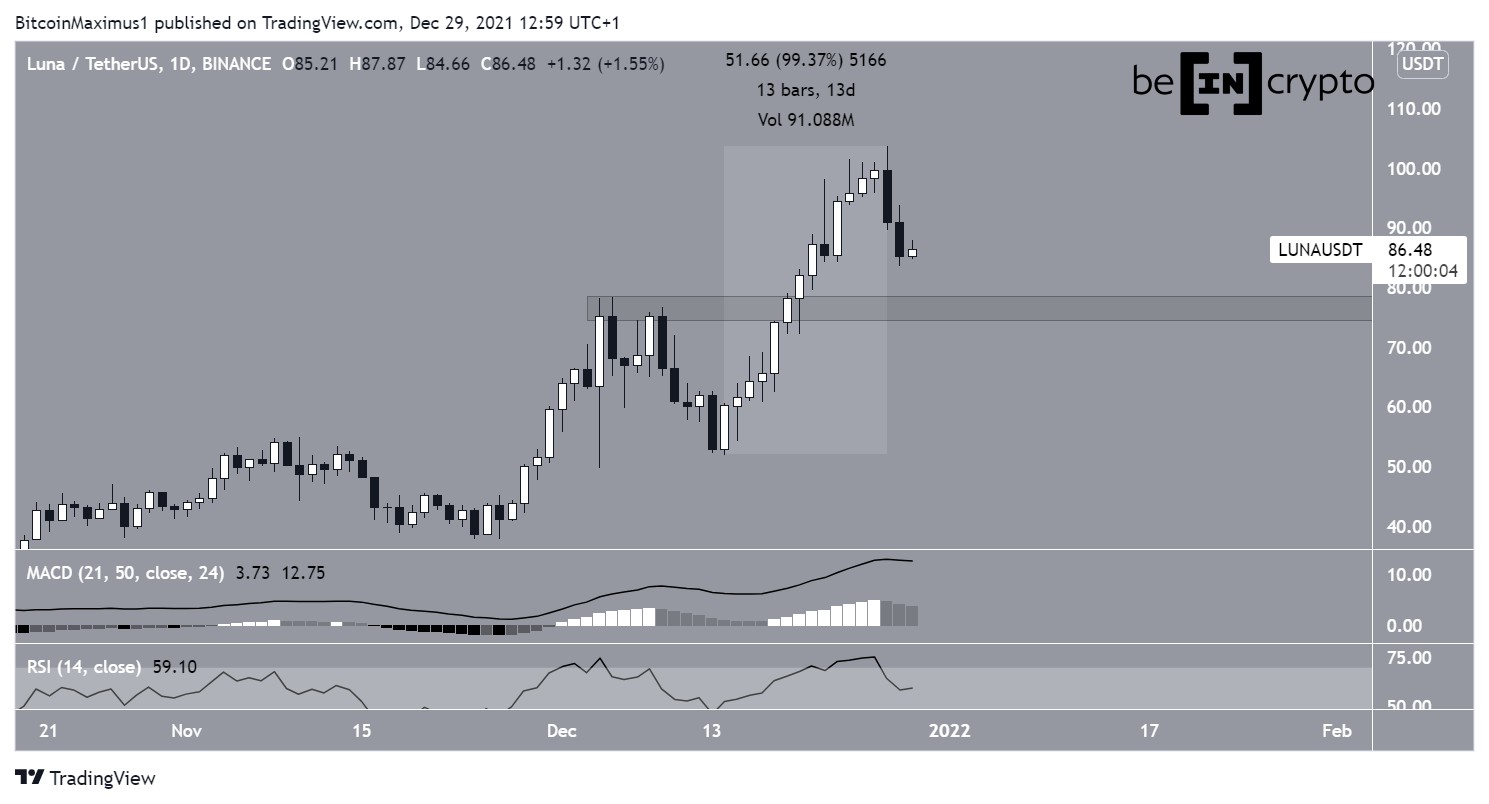
LUNA has been increasing at a parabolic rate since reaching a local low of $51.80 on Dec 14. Over the past 14 days, it has doubled in price, leading to a new all-time high of $103.60 on Dec 27.
However, it fell shortly afterward and is currently trading just above $80.
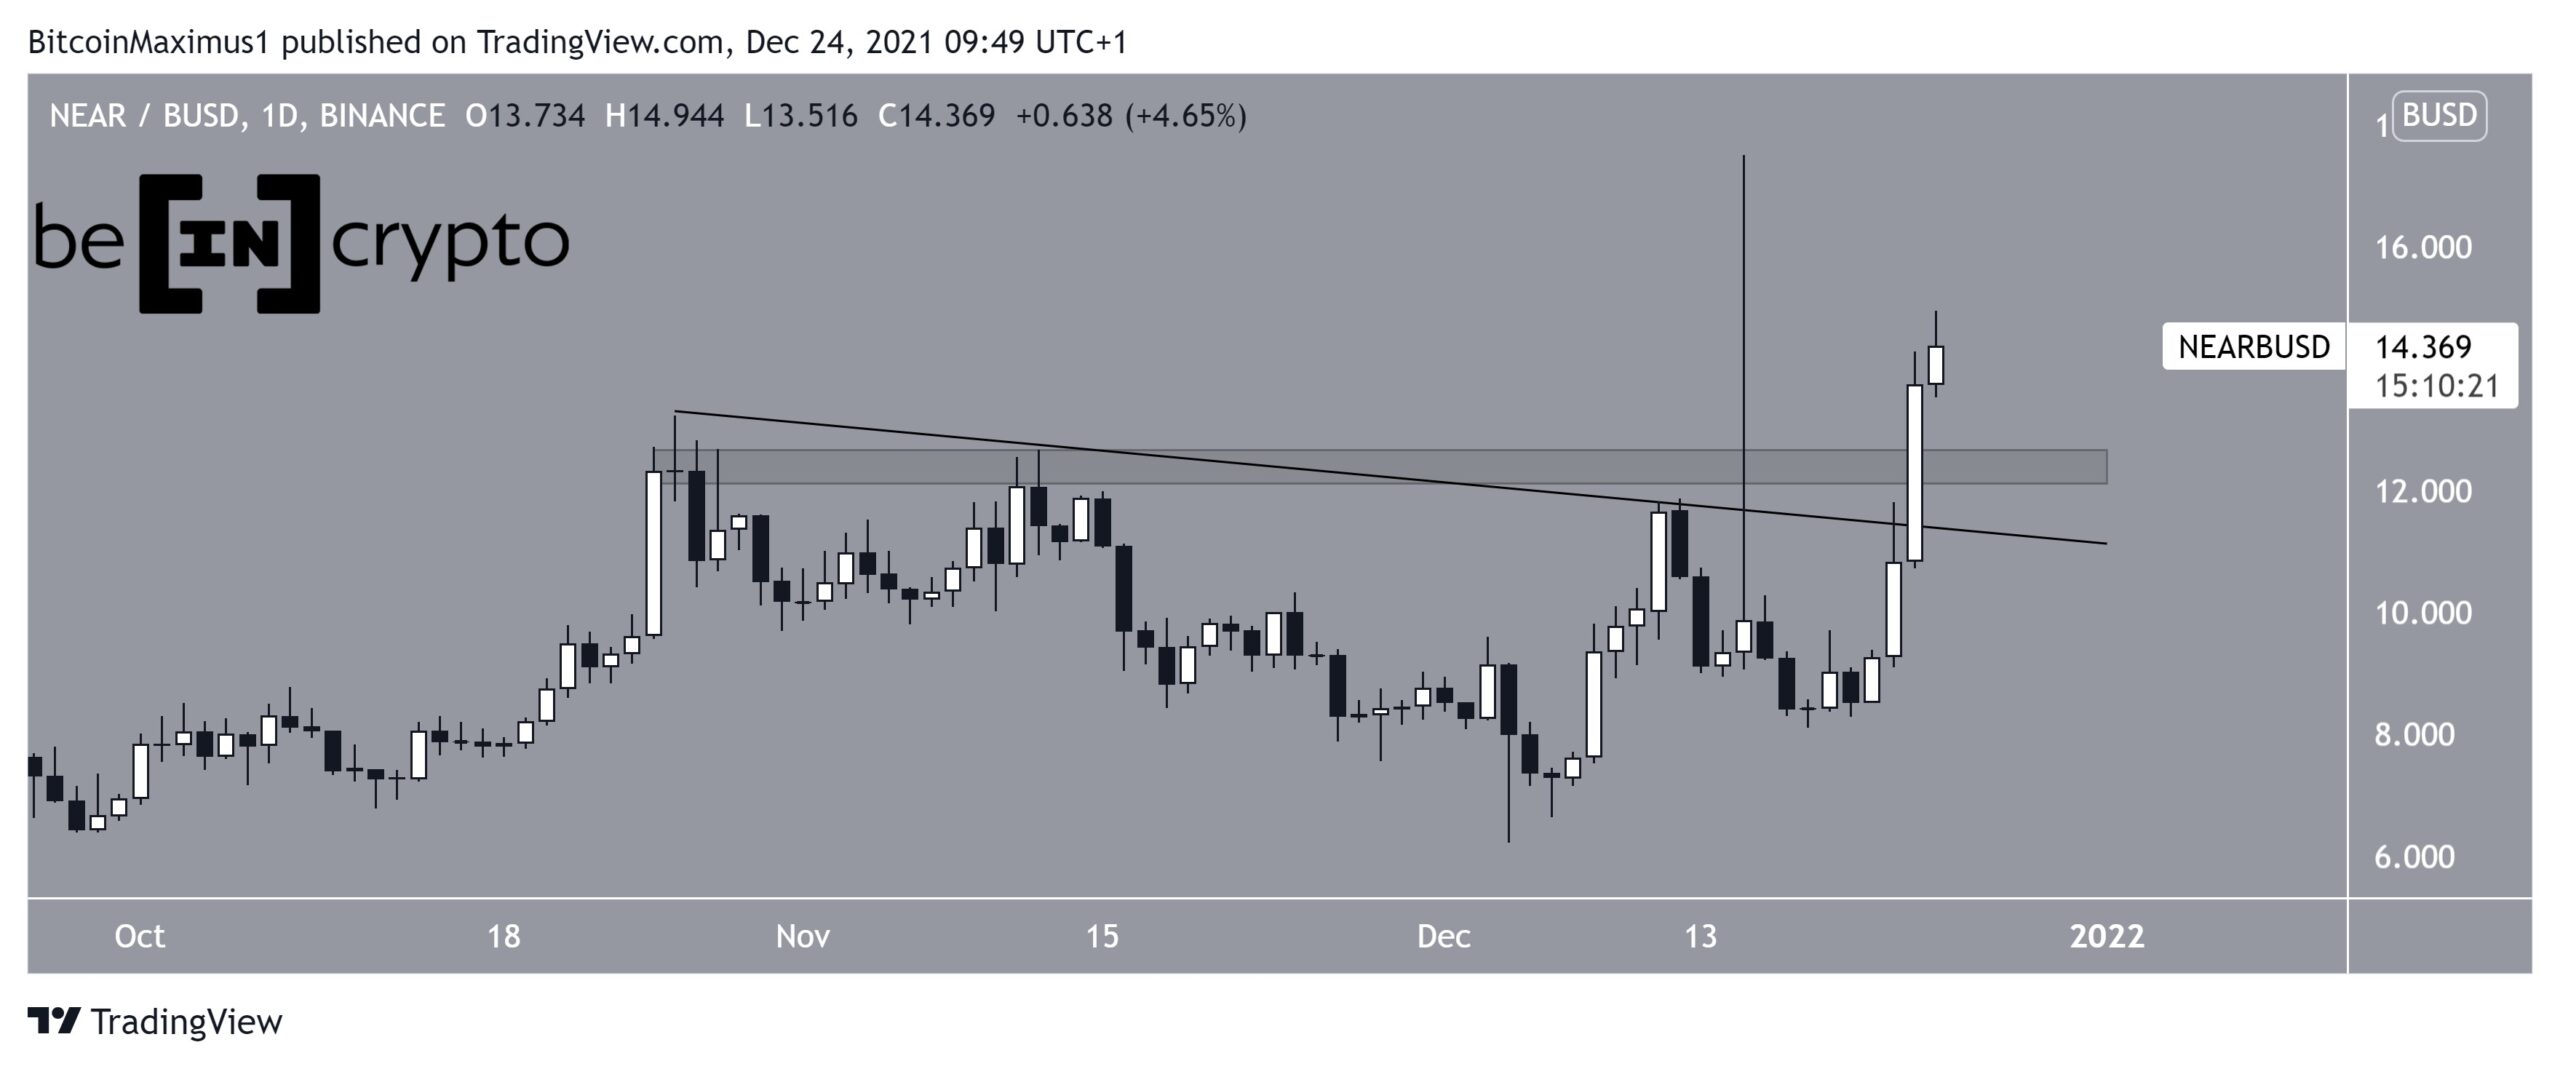
The closest support area is found at $77, created by the previous all-time high resistance area.
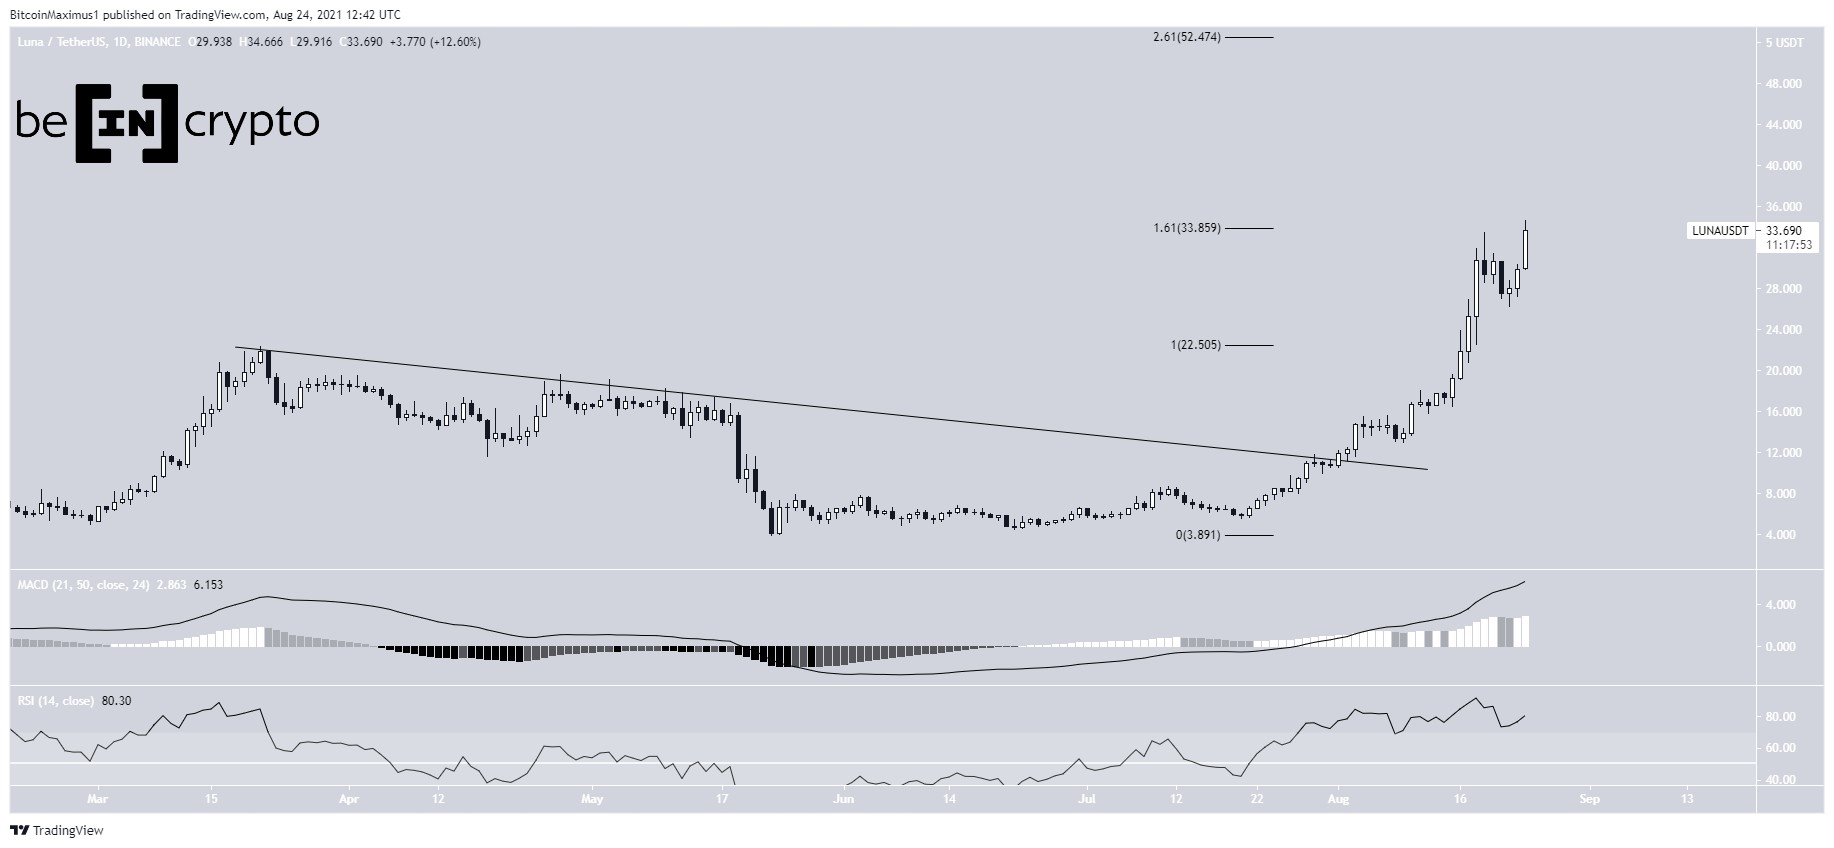
Technical indicators are showing signs of weakness. The MACD, which is created by short and long-term moving averages (MA), is falling, though it’s still positive. This means that while the short-term MA is decelerating, it’s still moving faster than the long-term average.
Similarly, the RSI has fallen below 70 but is holding steady over 50. The RSI is a momentum indicator, and values above 50 are considered bullish. However, the decrease below 70 suggests that momentum is waning.
Therefore, the daily time frame provides a mixed reading.
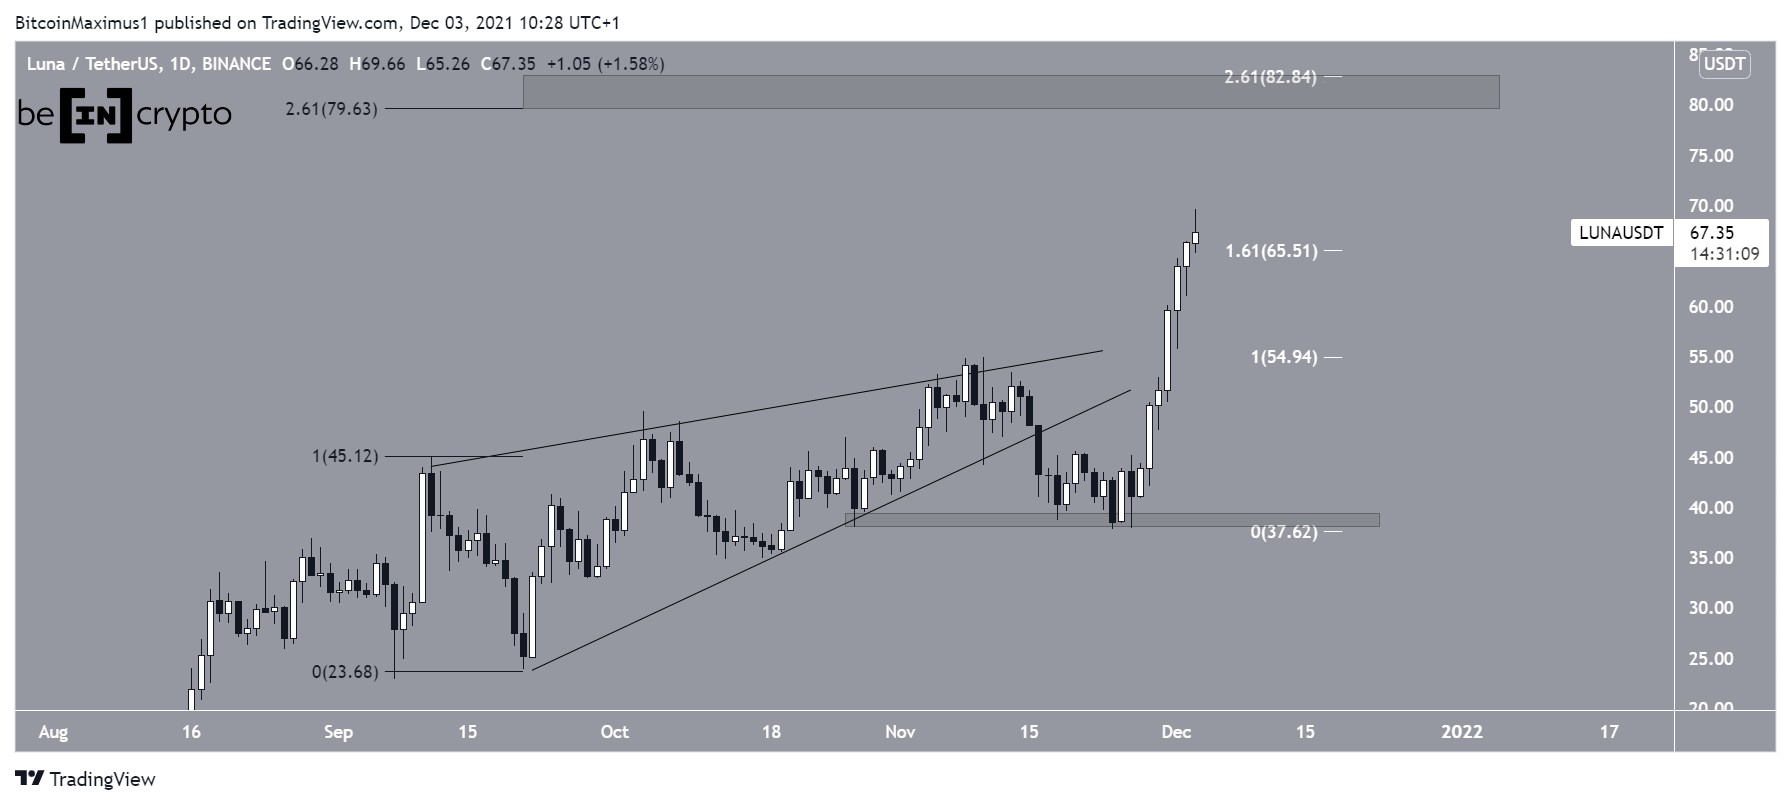
LUNA Chart By TradingView Potential topA look at Fib levels suggests that it’s possible that LUNA has reached a local top. The all-time high was created just above the 1.61 external Fib retracement level when measuring the most recent drop.
In addition to this, the high was made right at the 3.61 external Fib retracement (white) of the previous drop. The 3.61-4.61 external Fib range often acts as a top for market cycles.
LUNA Chart By TradingViewFurthermore, a look at the longer-term movement shows that LUNA has also reached the 4.61 external Fib retracement level of the pullback that it experienced between March and July. As outlined above, this level often acts as the top of market cycles.
In addition to this, the upward move throughout November and December had a 1:1 ratio (white) with the May-November increase (highlighted), further supporting the possibility that a top has been reached.
LUNA Chart By TradingView LUNA/BTCCryptocurrency trader @CryptoNTez tweeted a LUNA/BTC chart, stating that the current flip could lead to a new all-time high price.
Source: TwitterThe LUNA/BTC chart gives a similar outlook as the USD pair.
The pair has been increasing parabolically and has reached the 2.61 long-term external Fib retracement level (white) and the 1.61 short-term Fib (black).
Therefore, it’s possible that a local top has been reached.
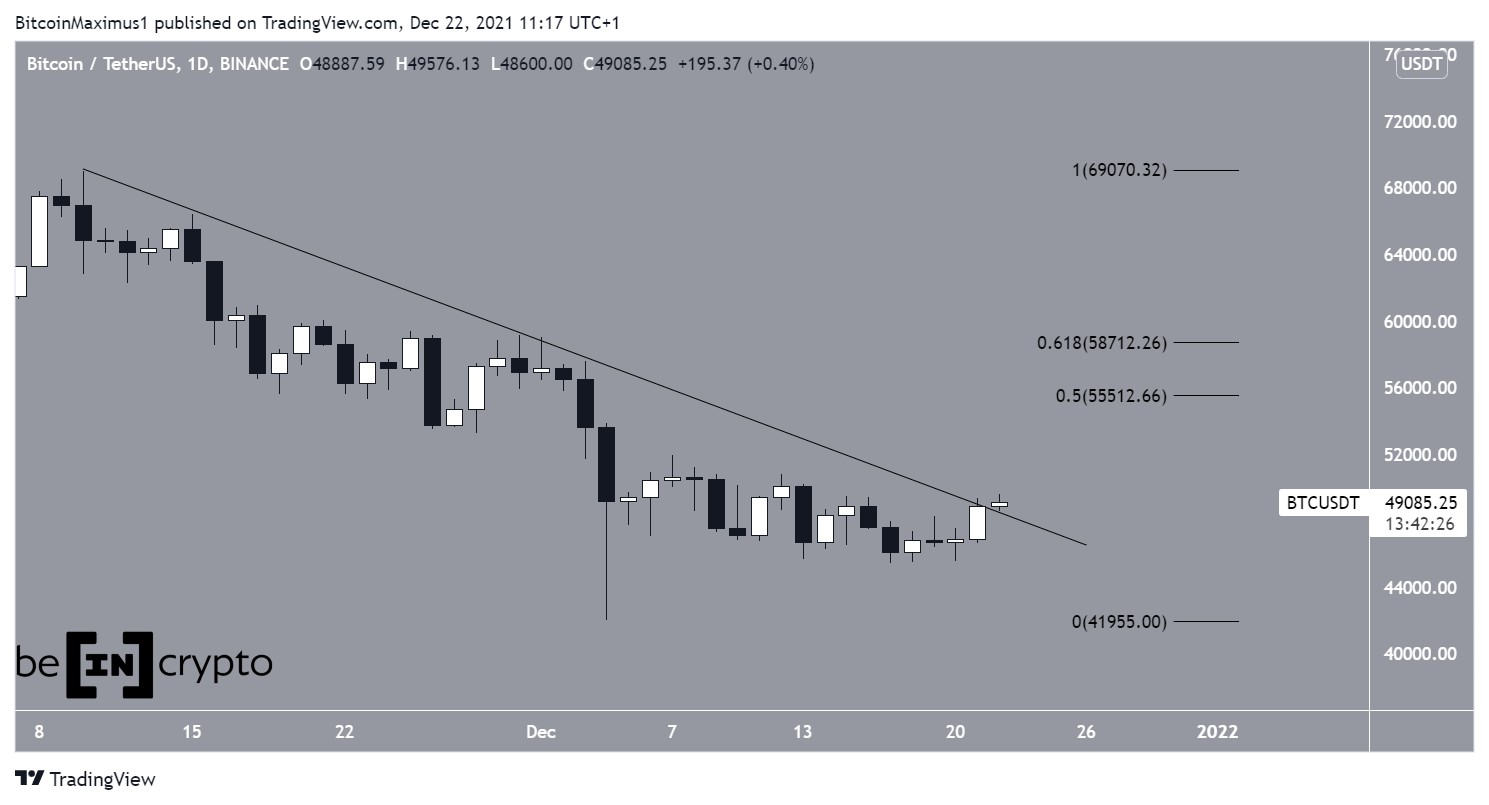
LUNA Chart By TradingViewFor BeInCrypto’s latest Bitcoin (BTC) analysis, click here
The post Terra (LUNA) Dips Back After Touching $103 All-Time High appeared first on BeInCrypto.
origin »Bitcoin price in Telegram @btc_price_every_hour
Terra KRW (KRT) на Currencies.ru
|
|