2021-9-22 08:08 |
Ethereum settled below the $3,000 support zone against the US Dollar. ETH price could resume its decline unless there is a clear break above the $3,000 resistance zone.
Ethereum started a fresh decline below the $3,100 and $3,000 support levels. The price is now trading below $3,000 and the 100 hourly simple moving average. There is a major bearish trend line forming with resistance near $3,000 on the hourly chart of ETH/USD (data feed via Kraken). The pair could resume its decline unless there is a clear break above the $3,000 resistance zone. Ethereum Price Remains At RiskEthereum started another decline from the $3,100 resistance zone. ETH traded below many important support zones near $3,000 and the 100 hourly simple moving average, similar to bitcoin.
The price even broke the $2,800 support level to move further into a bearish zone. A low is formed near $2,651 and the price is now correcting losses. There was a break above the $2,800 and $2,850 resistance levels.
The price recovered above the 23.6% Fib retracement level of the recent drop from the $3,105 swing high to $2,651 low. An immediate resistance on the upside is near the $2,880 level. There is also a major bearish trend line forming with resistance near $3,000 on the hourly chart of ETH/USD.
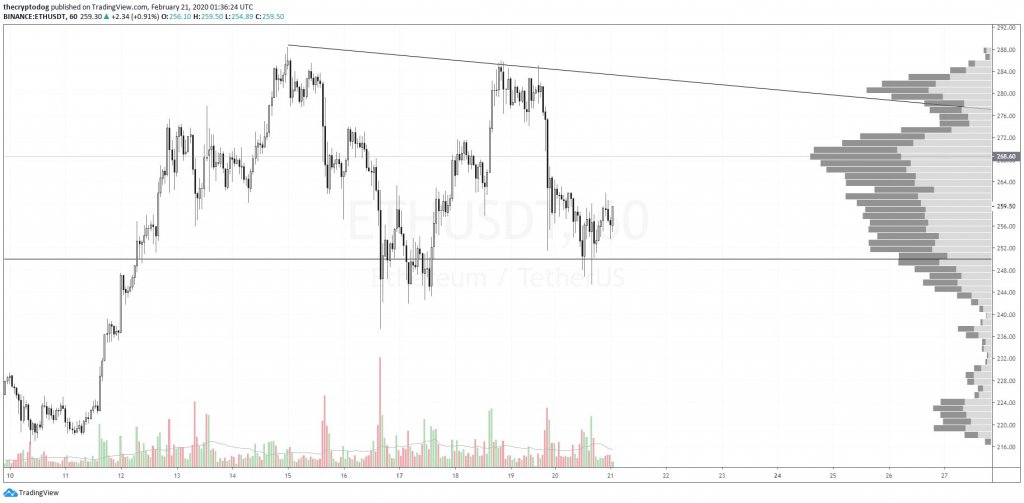
Source: ETHUSD on TradingView.comThe trend line is close to the 50% Fib retracement level of the recent drop from the $3,105 swing high to $2,651 low. A close above the $3,000 resistance could start a decent recovery. The next major resistance might be near the $3,105 level. A clear break and close above the $3,105 level could start a steady increase. The next major resistance sits near $3,135 and the 100 hourly SMA.
More Losses in ETH?If ethereum fails to correct higher above the $2,880 and $3,000 resistance levels, it could start another decline. An initial support on the downside is near the $2,800 level.
The next major support seems to be forming near the $2,650 level. A downside break below the $2,650 support zone could lead the price towards the $2,550 zone. The next major support is near the $2,500 level, below which ether price might decline towards the $2,420 support zone.
Technical Indicators
Hourly MACD – The MACD for ETH/USD is slowly losing pace in the bullish zone.
Hourly RSI – The RSI for ETH/USD is still below the 50 level.
Major Support Level – $2,650
Major Resistance Level – $3,000
origin »Bitcoin price in Telegram @btc_price_every_hour
Ethereum (ETH) на Currencies.ru
|
|