2018-9-8 17:10 |
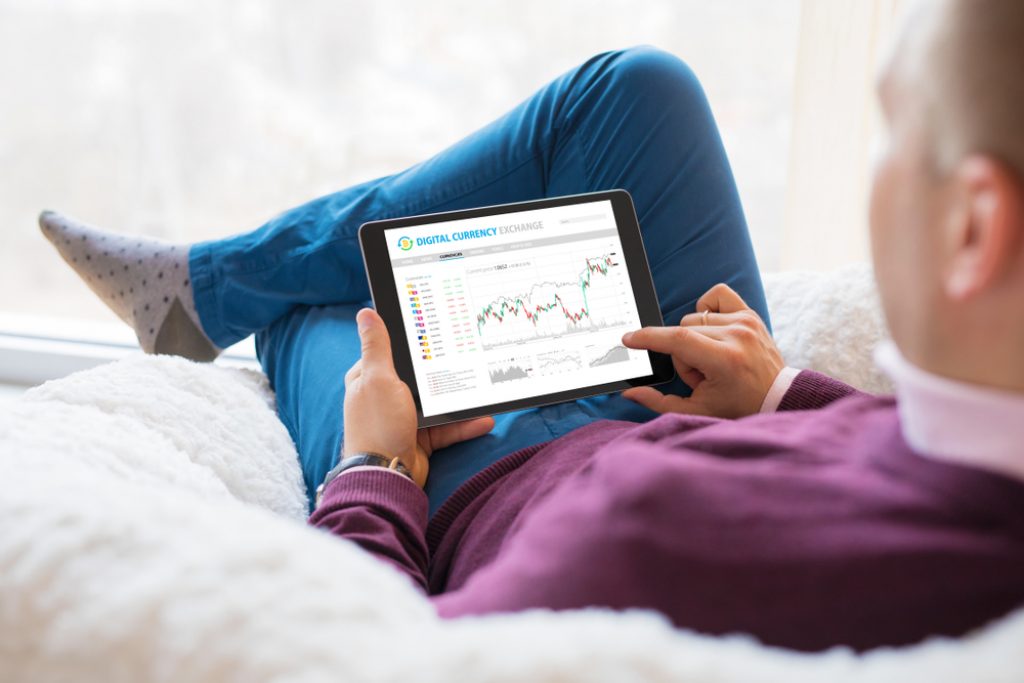
When the word “trading” occurs with a term, then “analysis” is also a part of the process apart from buying and selling. Just as forex and stock trading makes use of technical charts and indicators for analyzing the trend, so does the cryptocurrency trading.
As you may know, trading crypto assets is a tricky business. Moreover, not all the crypto traders would make use of those colorful candlesticks to decide their next move. It is true that these technical charts and indicators are not reliable sources but surely lend a helping hand to increase profits and reduce the risk of losing money.
Veteran traders would know that these charts and indicators are based on several entities like volume, moving average, etc. You do not need to refer to each and every chart available, just one based on each entity is enough to have a clear idea about the market conditions.
It gets easier for a trader to scrutinize the trend if these indicators are available on the trading platform itself. Among platforms, the volume indicator is present on almost all of them. This indicates the popularity of the volume indicator as it is readily available on all the platforms without the trader having to use third-party services.
Moreover, the survey conducted by Encrybit proves the aforementioned statements as a fact. Over 10,000 cryptocurrency traders from 161 different countries took part in this survey. The question to the participants was “Which Technical Indicator are you using Most of the Time?” with the following options:
Volume chart SMA EMA RSI MACD ATR ADX Other31% of the participants chose “Volume Chart.“
How Is Volume Helpful in Analyzing the Trend?Some traders consider volume as least significant, but in reality, it is not the case. It assists the trader to decide his/her next move. It works better when combined with a chart. Deliberated as the primeval indicator, it helps to assess the health of a trend.
If you are willing to calculate the positive and negative effects of the move, volume analysis serves as the best advisor. A wise trader will always think of carrying out a move with maximum strength and minimum weakness. The entry and exit positions can be determined from here.
However, analysis based on volume has not been that easy. It can disguisedly confuse a newbie if he/she is unaware of the tactics. A few tips for them:
“If the volume is rising, the market is rising. A price rise or drop over a little volume change is as a weak signal. Whereas price rise or drop over a large volume change is a strong signal.”
You can also identify bullish signs with the help of volume-based analysis. If the price drops and volume increases and then shows a sudden hike in price, you can consider this as a bullish sign.
Along with bullish sign identification, you can also save yourself from getting trapped in a false breakout. The survey also asked the traders if they have ever been trapped in a false breakout and 62% said Yes. There is a high possibility of false breakout when the volume is slightly changed during the initial breakout from the range.
In a NutshellTaking into account the survey facts and usefulness of volume in everyday trade; it is an excellent tool for profit gaining and less risky cryptocurrency trading. You can check whether the trend is strong or weak and make a firm decision. It is rather the simplest of all tools to decide the entry and exit points.
If used with precision, the profit can be maximized.
Survey: Volume Chart Is the Most Used Technical Indicator by Cryptocurrency Traders was originally found on [blokt] - Blockchain, Bitcoin & Cryptocurrency News.
origin »Bitcoin price in Telegram @btc_price_every_hour
Open Trading Network (OTN) на Currencies.ru
|
|