2023-4-12 23:05 |
Over the past few trading sessions, Stellar has attempted to advance on its chart. Within the last 24 hours, XLM experienced a close to 4% appreciation in value. However, on the weekly chart, Stellar did not observe any price increase. Nonetheless, the altcoin has finally surpassed its multi-week resistance level, and its technical outlook appears bullish at the time of writing.
The buying strength and demand for XLM have surged as accumulation rose on the chart. Furthermore, the altcoin has increased above its bearish order block, previously below the $0.094 price mark. The demand must remain consistent on its chart since the overhead resistance mark remains crucial for the altcoin.
Assuming that XLM surpasses the $0.100 price mark, it is likely that the recovery is underway. With Bitcoin increasing by 7% on its daily chart, other altcoins have also indicated positive price movements on their respective charts. Additionally, the market capitalization of XLM has registered an upward movement showing an increase in demand.
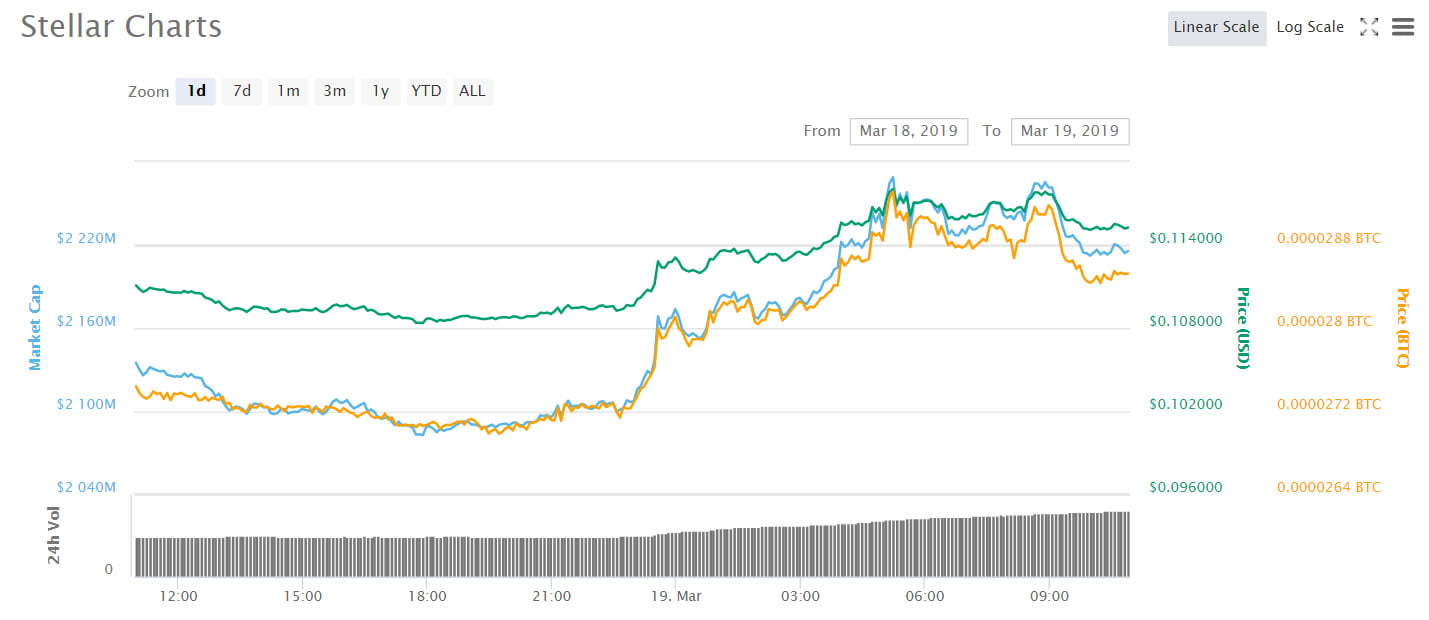
Stellar Price Analysis: One-Day ChartAt the time of writing, XLM was trading at $0.106. Buyers were activated as Stellar entered the $0.100 zone, and a move above the overhead resistance could take XLM to the overbought territory.
The immediate resistance was $0.108, and breaking above this mark would pave the way for XLM to target $0.113.
The amount of XLM traded during the last session was green, indicating increased buying strength. Conversely, support for Stellar stood at $0.102 and then at $0.098. If XLM falls below $0.098, it could bring the bears back.
Technical AnalysisFollowing its crossing of the $0.100 mark, the altcoin has recently experienced an upward movement on its chart. The Relative Strength Index was above the 60-mark, indicating strong demand on the chart. Similarly, XLM has risen above the 20-Simple Moving Average line as demand surges.
These trends suggest that buyers are in control and are driving the price momentum in the market. Price reversal, however, could occur as the 200-SMA line may cross over the 50-SMA line, resulting in a death cross. This could cause the altcoin to dip on its chart.
On the one-day chart, XLM has formed sell signals in line with a possible death cross. The Moving Average Convergence Divergence has depicted price momentum and reversal, with red signal bars indicating sell signals.
The Parabolic SAR, which portrays the price direction, has dotted lines appearing above the price candlestick, indicating the beginning of a downward trend. However, this impending reversal may be brief if buyers maintain their confidence.
origin »Bitcoin price in Telegram @btc_price_every_hour
Stellar (XLM) на Currencies.ru
|
|